\n
## Histogram: Rating Frequency Distribution
### Overview
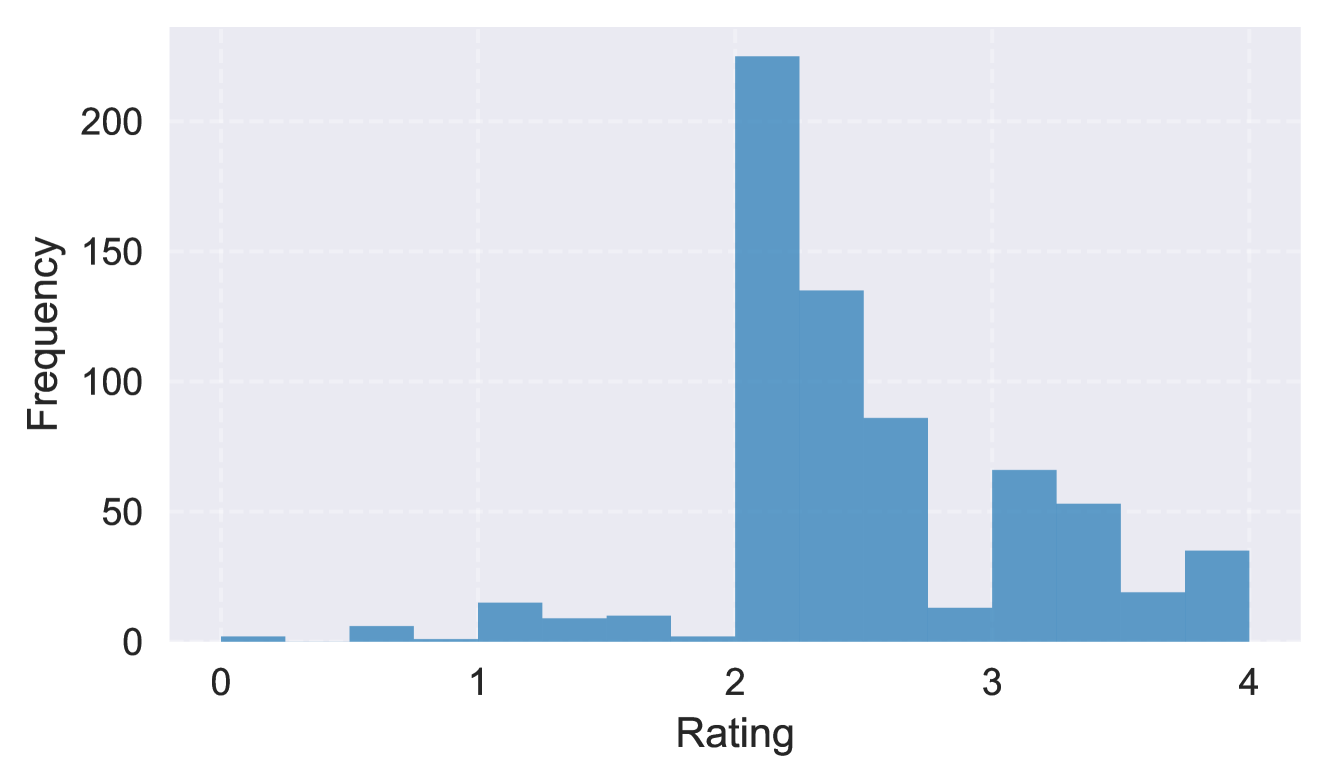
The image presents a histogram visualizing the frequency distribution of ratings. The x-axis represents the rating scale, and the y-axis represents the frequency (count) of each rating. The data appears to be discrete, with ratings ranging from 0 to 4.
### Components/Axes
* **X-axis Title:** "Rating"
* **Y-axis Title:** "Frequency"
* **X-axis Scale:** Ranges from 0 to 4, with tick marks at integer values.
* **Y-axis Scale:** Ranges from 0 to 200, with tick marks at intervals of 50.
* **Bars:** Represent the frequency of each rating.
### Detailed Analysis
The histogram shows a distinct distribution of ratings. The highest frequency occurs at a rating of 2, with approximately 210 occurrences. The frequency decreases as the rating moves away from 2 in either direction.
Here's a breakdown of approximate frequencies for each rating:
* **Rating 0:** Approximately 10 occurrences.
* **Rating 1:** Approximately 15 occurrences.
* **Rating 2:** Approximately 210 occurrences.
* **Rating 3:** Approximately 110 occurrences.
* **Rating 4:** Approximately 25 occurrences.
The bars are centered on the integer rating values (0, 1, 2, 3, 4). The width of each bar appears to be 1 unit.
### Key Observations
* The distribution is heavily skewed towards a rating of 2.
* Ratings of 0 and 1 are relatively rare.
* The frequency decreases significantly for ratings above 2.
* The data suggests a concentration of responses around the rating of 2.
### Interpretation
The histogram indicates that the majority of the ratings fall within the value of 2. This could suggest that the subject being rated is generally considered "average" or "moderate" based on this scale. The low frequencies for ratings of 0 and 1 suggest that very negative assessments are uncommon. The decline in frequency for ratings of 3 and 4 indicates that very positive assessments are also less frequent.
The shape of the distribution (peaked at 2 and decreasing towards the extremes) suggests a unimodal distribution. This implies that there is a single dominant rating value, and the ratings tend to cluster around that value. Without knowing the context of the ratings, it's difficult to draw more specific conclusions. However, the data clearly demonstrates a preference for the rating of 2.