## Screenshot: Web Interface for Content Annotation and Metadata Management
### Overview
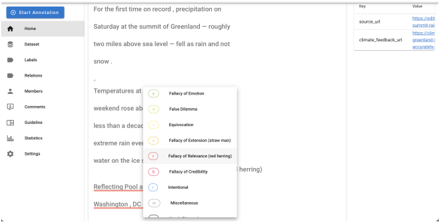
The image depicts a web-based interface designed for annotating and managing textual content. The layout includes a vertical sidebar menu, a main content area displaying text, and interactive elements like dropdown menus and tables. The interface appears to support collaborative annotation, metadata tagging, and source tracking.
### Components/Axes
#### Sidebar Menu (Left Panel)
- **Labels**: Home, Dataset, Labels, Relations, Members, Comments, Guideline, Statistics, Settings.
- **Icons**: Each menu item is paired with a distinct icon (e.g., house for Home, gear for Settings).
#### Main Content Area
- **Text Content**:
- A news snippet about precipitation at the summit of Greenland:
*"For the first time on record, precipitation on Saturday at the summit of Greenland — roughly two miles above sea level — fell as rain and not snow."*
- Partially obscured text mentioning "Temperatures at weekend rose ab..." and "extreme rain eve...".
- Highlighted text:
- *"Reflecting Pool"* (underlined in red).
- *"Washington, DC"* (bolded).
- **Dropdown Menu (Popup)**:
- Categories for content classification:
- Fallacy of Emotion
- False Dilemma
- Equivocation
- Fallacy of Extension (straw man)
- Fallacy of Relevance (red herring)
- Fallacy of Credibility
- Intentional
- Miscellaneous
- Each category is represented by a colored circle (e.g., red for "Fallacy of Relevance").
#### Table (Top-Right Corner)
- **Structure**: Two rows with key-value pairs.
- `source_url`: [https://www.summertime...](https://www.summertime...)
- `climate_feedback_url`: [https://climate...](https://climate...)
- **Purpose**: Likely links to source documentation or feedback forms.
### Detailed Analysis
- **Sidebar Functionality**: The menu suggests a modular system for organizing datasets, annotations, and user roles.
- **Dropdown Categories**: The fallacy labels imply the interface is used for critical analysis, possibly in academic or journalistic contexts.
- **Highlighted Text**: The red underline and bold formatting indicate user annotations or tags for emphasis.
- **Table Metadata**: The URLs suggest traceability to external sources or collaborative feedback mechanisms.
### Key Observations
1. **Partial Obscuration**: The dropdown menu partially blocks the main text, suggesting dynamic UI interactions.
2. **Color Coding**: Dropdown categories use distinct colors (e.g., red for "Fallacy of Relevance"), but no legend explicitly maps colors to categories.
3. **URLs**: The truncated URLs in the table hint at external resources but lack full visibility.
### Interpretation
This interface likely serves as a tool for collaborative content curation, annotation, and fact-checking. The fallacy categories suggest a focus on logical analysis, while the metadata table emphasizes source transparency. The highlighted text ("Reflecting Pool," "Washington, DC") may indicate user-added context or tags for filtering/searching. The design prioritizes modularity, with the sidebar enabling navigation between datasets, annotations, and user management. The absence of numerical data or charts implies the primary function is qualitative rather than quantitative analysis.