# Technical Document Extraction: Success Rate with Nodes Visited
## Chart Title
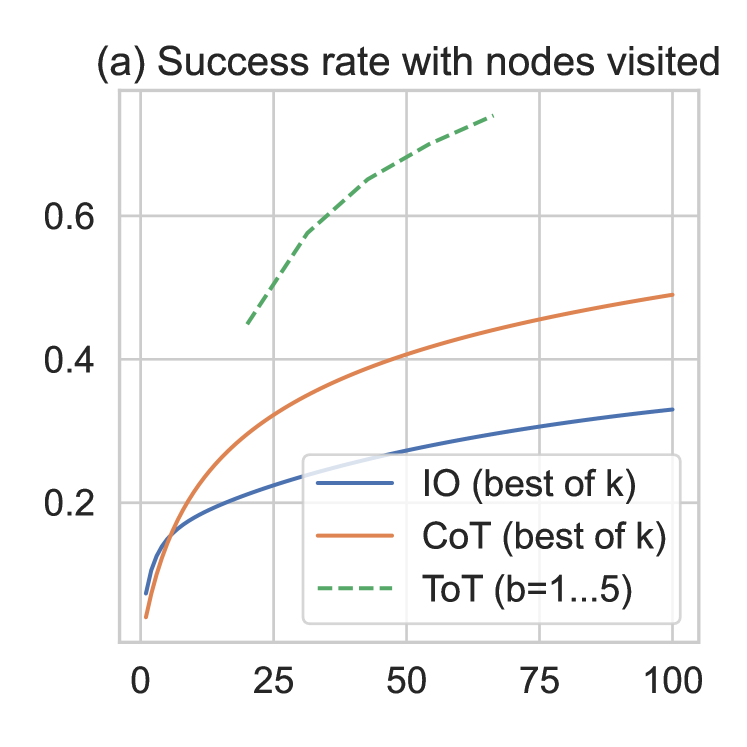
- **(a) Success rate with nodes visited**
## Axes
- **X-axis (Horizontal):**
- Label: `nodes visited`
- Range: `0` to `100`
- Increment: `25` (markers at 0, 25, 50, 75, 100)
- **Y-axis (Vertical):**
- Label: `Success rate`
- Range: `0` to `0.6`
- Increment: `0.2` (markers at 0, 0.2, 0.4, 0.6)
## Legend
- **Location:** Bottom-right corner
- **Entries:**
1. **Blue solid line:** `IO (best of k)`
2. **Orange solid line:** `CoT (best of k)`
3. **Green dashed line:** `ToT (b=1...5)`
## Key Trends
1. **IO (best of k):**
- Starts at `(0, 0.1)` and increases steadily.
- Reaches `(100, 0.35)`.
- Slope: Gradual upward curve.
2. **CoT (best of k):**
- Starts at `(0, 0)` and rises sharply initially.
- Reaches `(100, 0.5)`.
- Slope: Steeper than IO, plateaus near `x=75`.
3. **ToT (b=1...5):**
- Starts at `(25, 0.45)` (no data before `x=25`).
- Peaks at `(75, 0.7)`.
- Slope: Sharp rise followed by a plateau.
## Data Points
| Line | Key Points (x, y) |
|------------|---------------------------------------|
| IO | (0, 0.1), (25, 0.2), (50, 0.3), (75, 0.33), (100, 0.35) |
| CoT | (0, 0), (25, 0.35), (50, 0.4), (75, 0.45), (100, 0.5) |
| ToT | (25, 0.45), (50, 0.6), (75, 0.7), (100, 0.7) |
## Observations
- **IO vs. CoT:** CoT outperforms IO across all node counts, with a larger gap at higher values (e.g., `x=100`).
- **ToT Anomaly:** ToT begins at `x=25` and exceeds both IO and CoT at `x=75`, but plateaus at `x=100`.
- **Legend Consistency:** Colors and labels in the legend match the lines in the graph without discrepancies.
## Notes
- The graph compares three strategies (`IO`, `CoT`, `ToT`) for success rate as a function of nodes visited.
- `ToT` uses a parameter range `b=1...5`, while `IO` and `CoT` use a "best of k" approach.
- No data is plotted for `ToT` before `x=25`, suggesting initialization or threshold constraints.