# Technical Document Extraction: Success Rate Analysis
## 1. Component Isolation
* **Header:** Contains the figure title "(a) Success rate with nodes visited".
* **Main Chart:** A line graph plotted on a Cartesian coordinate system with a white background and a light gray grid.
* **Legend:** Located in the bottom-right quadrant of the chart area.
* **Axes:**
* **X-axis:** Numerical scale representing "nodes visited" (implied by title).
* **Y-axis:** Numerical scale representing "Success rate" (implied by title).
---
## 2. Metadata and Axis Information
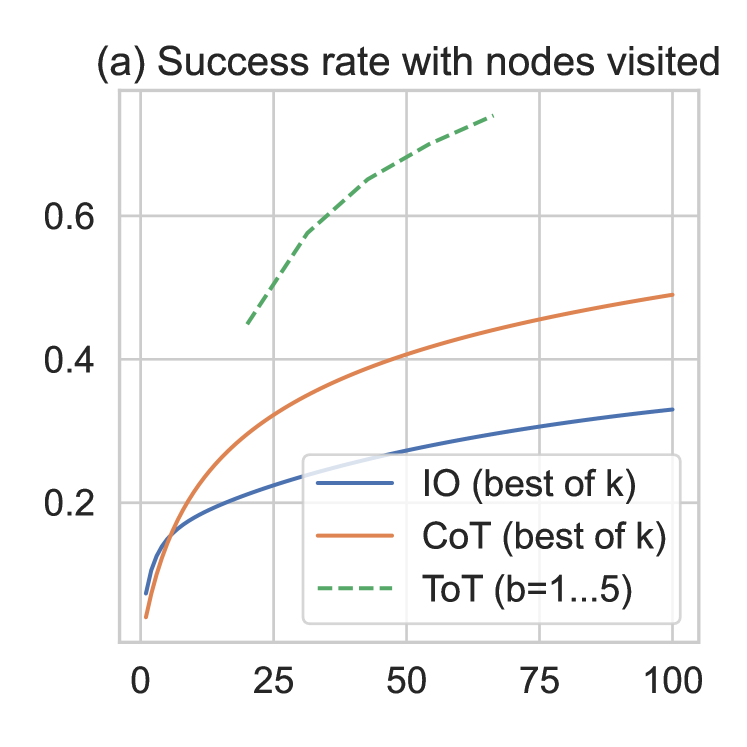
* **Title:** (a) Success rate with nodes visited
* **X-axis Markers:** 0, 25, 50, 75, 100
* **Y-axis Markers:** 0.2, 0.4, 0.6
* **Grid:** Major grid lines are present for both X and Y axes at the intervals specified by the markers.
---
## 3. Legend and Data Series Identification
The legend is positioned at approximately `[x=0.65, y=0.25]` relative to the chart area.
| Series Label | Line Color | Line Style | Visual Trend Description |
| :--- | :--- | :--- | :--- |
| **IO (best of k)** | Blue | Solid | Logarithmic growth; starts highest at very low x-values but is overtaken by CoT quickly. Slopes upward with decreasing marginal gains. |
| **CoT (best of k)** | Orange | Solid | Logarithmic growth; starts lower than IO but crosses it early (approx. x=5) and maintains a higher success rate throughout. |
| **ToT (b=1...5)** | Green | Dashed | Steep upward slope; starts at a much higher x-value (approx. 20) and significantly outperforms both IO and CoT for the same number of nodes. |
---
## 4. Data Point Extraction and Analysis
### Series 1: IO (best of k) [Solid Blue Line]
* **Trend:** Steady, slow increase.
* **Approximate Values:**
* x=1: ~0.08
* x=25: ~0.22
* x=50: ~0.27
* x=75: ~0.30
* x=100: ~0.33
### Series 2: CoT (best of k) [Solid Orange Line]
* **Trend:** Moderate increase, consistently higher than IO after the initial start.
* **Approximate Values:**
* x=1: ~0.05
* x=5: ~0.15 (Crosses IO line here)
* x=25: ~0.32
* x=50: ~0.41
* x=75: ~0.46
* x=100: ~0.49
### Series 3: ToT (b=1...5) [Dashed Green Line]
* **Trend:** Rapid increase. This series begins at a higher "nodes visited" threshold (approx. 20 nodes).
* **Approximate Values:**
* x=20: ~0.45 (Starting point)
* x=30: ~0.57
* x=45: ~0.66
* x=65: ~0.74 (Ending point)
---
## 5. Summary of Findings
The chart compares three methods—**IO (Input-Output)**, **CoT (Chain of Thought)**, and **ToT (Tree of Thoughts)**—based on their success rate relative to the number of nodes visited.
1. **Efficiency:** **ToT (Tree of Thoughts)** is the most efficient method. Even though it requires a minimum of approximately 20 nodes to start, its success rate at 20 nodes (~0.45) is already higher than the success rate of **IO** at 100 nodes (~0.33) and nearly equal to **CoT** at 75 nodes.
2. **Comparison of IO vs. CoT:** While **IO** starts with a slightly higher success rate at a single node, **CoT** scales much better as more nodes (k) are visited, surpassing IO very early in the process.
3. **Performance Ceiling:** Within the observed range, **ToT** reaches a success rate of nearly 0.75 by 65 nodes, whereas **CoT** and **IO** remain below 0.50 even at 100 nodes.