## Chart: Microlensing Caustic Structures
### Overview
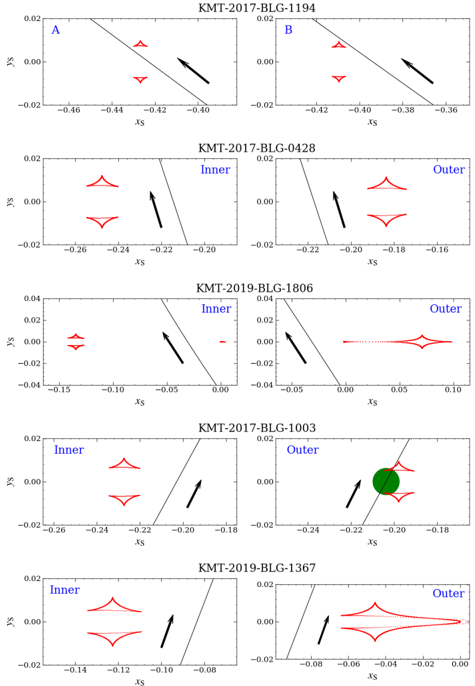
The image presents six separate plots, each depicting the caustic structure of a microlensing event. Each plot shows the xS and yS coordinates, with red lines indicating the caustic curves. A black arrow indicates the direction of motion. The plots are labeled with the event name (e.g., KMT-2017-BLG-1194) and, in some cases, "Inner" or "Outer" to distinguish between different caustic regions.
### Components/Axes
* **Axes:** Each plot has an x-axis labeled "xS" and a y-axis labeled "yS".
* The y-axis ranges from approximately -0.02 to 0.02 in the top two rows, and from -0.04 to 0.04 in the middle row, and -0.02 to 0.02 in the bottom two rows.
* The x-axis ranges vary for each plot, as detailed below.
* **Titles:** Each plot has a title indicating the microlensing event name (e.g., "KMT-2017-BLG-1194").
* **Caustic Curves:** Red lines represent the caustic curves.
* **Motion Vector:** A black arrow indicates the direction of motion.
* **Region Labels:** Some plots are labeled with "Inner" or "Outer" in blue text.
### Detailed Analysis
**Plot 1: KMT-2017-BLG-1194 (A)**
* x-axis: Ranges from approximately -0.46 to -0.36.
* y-axis: Ranges from approximately -0.02 to 0.02.
* Caustic Structure: Two small, triangular-shaped caustics are visible.
* Motion Vector: Points towards the top-right.
**Plot 2: KMT-2017-BLG-1194 (B)**
* x-axis: Ranges from approximately -0.42 to -0.36.
* y-axis: Ranges from approximately -0.02 to 0.02.
* Caustic Structure: Two small, triangular-shaped caustics are visible.
* Motion Vector: Points towards the top-right.
**Plot 3: KMT-2017-BLG-0428 (Inner)**
* x-axis: Ranges from approximately -0.26 to -0.20.
* y-axis: Ranges from approximately -0.02 to 0.02.
* Caustic Structure: A single, larger caustic structure is visible.
* Motion Vector: Points upwards and slightly to the right.
**Plot 4: KMT-2017-BLG-0428 (Outer)**
* x-axis: Ranges from approximately -0.22 to -0.16.
* y-axis: Ranges from approximately -0.02 to 0.02.
* Caustic Structure: A single, larger caustic structure is visible.
* Motion Vector: Points upwards and slightly to the right.
**Plot 5: KMT-2019-BLG-1806 (Inner)**
* x-axis: Ranges from approximately -0.15 to 0.00.
* y-axis: Ranges from approximately -0.04 to 0.04.
* Caustic Structure: A small caustic structure is visible.
* Motion Vector: Points upwards and slightly to the right.
**Plot 6: KMT-2019-BLG-1806 (Outer)**
* x-axis: Ranges from approximately -0.05 to 0.10.
* y-axis: Ranges from approximately -0.04 to 0.04.
* Caustic Structure: A larger caustic structure is visible.
* Motion Vector: Points upwards and slightly to the right.
**Plot 7: KMT-2017-BLG-1003 (Inner)**
* x-axis: Ranges from approximately -0.26 to -0.18.
* y-axis: Ranges from approximately -0.02 to 0.02.
* Caustic Structure: A single, larger caustic structure is visible.
* Motion Vector: Points upwards and slightly to the right.
**Plot 8: KMT-2017-BLG-1003 (Outer)**
* x-axis: Ranges from approximately -0.24 to -0.18.
* y-axis: Ranges from approximately -0.02 to 0.02.
* Caustic Structure: A single, larger caustic structure is visible. A green circle is drawn over the caustic.
* Motion Vector: Points upwards and slightly to the right.
**Plot 9: KMT-2019-BLG-1367 (Inner)**
* x-axis: Ranges from approximately -0.14 to -0.08.
* y-axis: Ranges from approximately -0.02 to 0.02.
* Caustic Structure: A single, larger caustic structure is visible.
* Motion Vector: Points upwards and slightly to the right.
**Plot 10: KMT-2019-BLG-1367 (Outer)**
* x-axis: Ranges from approximately -0.08 to 0.00.
* y-axis: Ranges from approximately -0.02 to 0.02.
* Caustic Structure: A single, larger caustic structure is visible.
* Motion Vector: Points upwards and slightly to the right.
### Key Observations
* Each plot represents a different microlensing event or a different region (Inner/Outer) of the same event.
* The caustic structures vary in size and shape across the different events.
* The motion vectors generally point in a similar direction (upwards and slightly to the right), but there are slight variations.
* The green circle in Plot 8 is an anomaly and may indicate a specific feature or event related to that caustic.
### Interpretation
The plots illustrate the complex caustic structures that can arise in microlensing events. The different shapes and sizes of the caustics, along with the motion vectors, provide information about the lens system's configuration and dynamics. The "Inner" and "Outer" labels suggest that some events have multiple caustic regions, potentially due to the presence of multiple lenses. The green circle in one of the plots likely highlights a specific feature or event of interest within that particular caustic structure. The data suggests that microlensing events can exhibit a wide range of caustic morphologies, reflecting the diversity of lens systems in the galaxy.