## Scatter Plots: KMT-BLG Event Data Analysis
### Overview
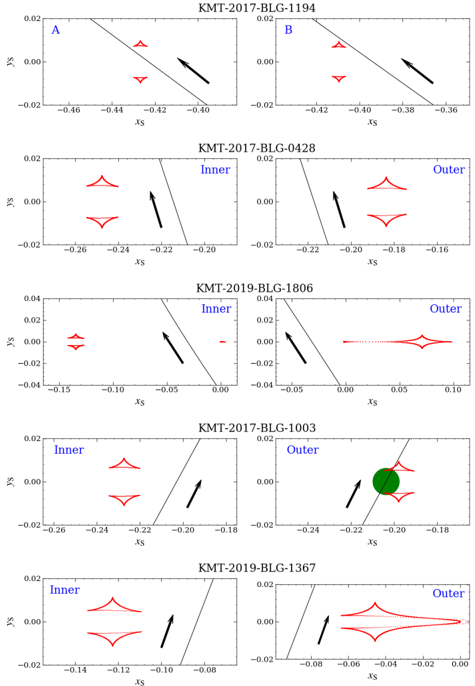
The image contains six scatter plots arranged in a 3x2 grid, each representing data from different KMT-BLG events (e.g., KMT-2017-BLG-1194, KMT-2017-BLG-0428, etc.). Each plot features two axes (x_s and y_s) with directional arrows, red and green geometric shapes (triangles and circles), and blue text labels ("Inner" and "Outer"). The plots are labeled with event identifiers and include directional indicators.
---
### Components/Axes
- **Axes**:
- **x_s**: Horizontal axis, labeled with numerical values (e.g., -0.46 to -0.36 in the top row).
- **y_s**: Vertical axis, labeled with numerical values (e.g., -0.02 to 0.02).
- **Legends**:
- **Red**: Labeled "Inner" (triangles).
- **Green**: Labeled "Outer" (circles).
- **Text Labels**:
- "Inner" and "Outer" in blue, positioned near the plots.
- Event identifiers (e.g., "KMT-2017-BLG-1194") at the top of each plot.
- **Arrows**: Black arrows indicating directional trends (e.g., from lower-left to upper-right).
---
### Detailed Analysis
#### KMT-2017-BLG-1194 (Top-Left)
- **Data Points**: Red triangles (Inner) clustered around x_s ≈ -0.45 to -0.40, y_s ≈ -0.02 to 0.02.
- **Trend**: Arrow points from lower-left to upper-right, suggesting a directional flow.
- **Legend**: Red = Inner, Green = Outer (no green data points here).
#### KMT-2017-BLG-0428 (Top-Right)
- **Data Points**:
- Red triangles (Inner) in upper-right (x_s ≈ -0.20 to -0.18, y_s ≈ 0.02).
- Green circle (Outer) in lower-left (x_s ≈ -0.26, y_s ≈ -0.02).
- **Trend**: Arrow points from lower-left to upper-right.
- **Legend**: Red = Inner, Green = Outer.
#### KMT-2019-BLG-1806 (Middle-Left)
- **Data Points**: Red triangles (Inner) in lower-left (x_s ≈ -0.15 to -0.10, y_s ≈ -0.04 to 0.02).
- **Trend**: Arrow points from lower-left to upper-right.
- **Legend**: Red = Inner, Green = Outer (no green data points here).
#### KMT-2017-BLG-1003 (Middle-Right)
- **Data Points**:
- Red triangles (Inner) in upper-right (x_s ≈ -0.20 to -0.18, y_s ≈ 0.02).
- Green circle (Outer) in lower-left (x_s ≈ -0.24, y_s ≈ -0.02).
- **Trend**: Arrow points from lower-left to upper-right.
- **Legend**: Red = Inner, Green = Outer.
#### KMT-2019-BLG-1367 (Bottom-Left)
- **Data Points**: Red triangles (Inner) in upper-right (x_s ≈ -0.14 to -0.10, y_s ≈ -0.02 to 0.02).
- **Trend**: Arrow points from lower-left to upper-right.
- **Legend**: Red = Inner, Green = Outer (no green data points here).
#### KMT-2019-BLG-1367 (Bottom-Right)
- **Data Points**: Red triangles (Inner) in upper-right (x_s ≈ -0.08 to 0.00, y_s ≈ 0.02).
- **Trend**: Arrow points from lower-left to upper-right.
- **Legend**: Red = Inner, Green = Outer (no green data points here).
---
### Key Observations
1. **Directional Arrows**: All plots show arrows pointing from lower-left to upper-right, indicating a consistent directional trend across events.
2. **Data Distribution**:
- "Inner" (red) data points are consistently in the lower-left or upper-right regions.
- "Outer" (green) data points appear only in specific plots (e.g., KMT-2017-BLG-0428, KMT-2017-BLG-1003).
3. **Anomalies**:
- A green circle (Outer) in KMT-2017-BLG-1003 is positioned near the center, distinct from other data points.
- Some plots (e.g., KMT-2019-BLG-1806) lack green data points, suggesting variability in Outer region representation.
---
### Interpretation
The plots likely represent spatial or temporal data from KMT-BLG events, with "Inner" and "Outer" regions differentiated by color. The directional arrows suggest a systematic flow or progression (e.g., movement, expansion, or interaction). The presence of green circles in specific plots may indicate unique events or outliers in the Outer region. The absence of green in some plots could reflect event-specific conditions or data limitations. The consistent directional trend across all plots implies a shared underlying mechanism or process influencing the data.