## Diagram: Model Forward Pass and JSD Computation
### Overview
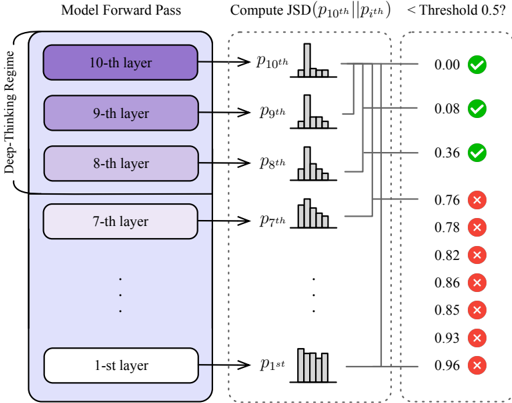
The image illustrates a model forward pass through multiple layers, followed by the computation of the Jensen-Shannon Divergence (JSD) between the output distribution of the 10th layer and the output distributions of each preceding layer. The JSD values are then compared to a threshold of 0.5, with the results indicated by green checkmarks (JSD < 0.5) or red crosses (JSD >= 0.5).
### Components/Axes
* **Left Side:** Represents the "Model Forward Pass" within a "Deep-Thinking Regime." It shows a stack of layers, from the 1st layer at the bottom to the 10th layer at the top. The layers are represented as rounded rectangles, with the color gradient changing from light purple at the bottom to dark purple at the top.
* **Middle:** Shows the probability distributions (histograms) `p_1st` through `p_10th` corresponding to the output of each layer. Lines connect each layer to its corresponding probability distribution.
* **Right Side:** Displays the computed JSD values between `p_10th` and each `p_ith`, along with a boolean indicator (checkmark or cross) based on whether the JSD is below the threshold of 0.5.
* **Labels:**
* "Model Forward Pass" (top-left)
* "Deep-Thinking Regime" (vertical label on the left side)
* "Compute JSD(p10th || pith) < Threshold 0.5?" (top-right)
* Layer labels: "1-st layer", "7-th layer", "8-th layer", "9-th layer", "10-th layer"
* Distribution labels: "p1st", "p7th", "p8th", "p9th", "p10th"
### Detailed Analysis or ### Content Details
* **Layer Stack:**
* 10-th layer (top): Darkest purple
* 9-th layer: Medium-dark purple
* 8-th layer: Medium purple
* 7-th layer: Light purple
* 1-st layer (bottom): Lightest purple
* Ellipsis (...) indicates omitted layers between the 7th and 1st layers.
* **JSD Values and Threshold Comparison:**
* p10th: 0.00 (Green Checkmark)
* p9th: 0.08 (Green Checkmark)
* p8th: 0.36 (Green Checkmark)
* p7th: 0.76 (Red Cross)
* ... (omitted layers)
* p1st: 0.96 (Red Cross)
* Other JSD values (with Red Crosses): 0.78, 0.82, 0.86, 0.85, 0.93
### Key Observations
* The JSD values generally increase as the layer number decreases (moving from the 10th layer towards the 1st layer).
* The JSD values for the 10th, 9th, and 8th layers are below the threshold of 0.5, indicating that their output distributions are relatively similar to that of the 10th layer.
* The JSD values for the 7th layer and below are above the threshold of 0.5, indicating that their output distributions are significantly different from that of the 10th layer.
### Interpretation
The diagram illustrates how the output distributions of different layers in a deep learning model diverge as the forward pass progresses. The JSD values quantify this divergence, with higher values indicating greater dissimilarity. The threshold comparison highlights which layers produce outputs that are significantly different from the final (10th) layer's output. This information could be used to understand the model's internal representations and identify layers that contribute most to the final output. The "Deep-Thinking Regime" label suggests that this analysis is relevant to understanding how the model develops complex representations as information flows through its layers. The increasing JSD values as you move towards earlier layers suggest that earlier layers have more diverse representations compared to the final layer.