\n
## Diagram: Deep-Thinking Regime and JSD Computation
### Overview
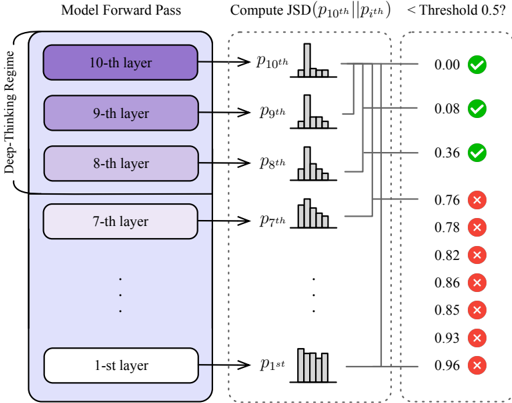
The image is a diagram illustrating a process involving a "Deep-Thinking Regime" represented as a stack of layers, and a computation of Jensen-Shannon Divergence (JSD) between probability distributions at different layers. The diagram shows how JSD values change as you move from the 10th layer to the 1st layer, and compares them against a threshold.
### Components/Axes
The diagram is divided into two main sections:
1. **Model Forward Pass (Deep-Thinking Regime):** A vertical stack of rectangular blocks representing layers of a model. The layers are labeled from "10-th layer" at the top to "1-st layer" at the bottom, with ellipses indicating intermediate layers. A label "Deep-Thinking Regime" is placed on the left side of the stack.
2. **Compute JSD (p10th || p7th):** A section to the right of the layer stack, showing histograms representing probability distributions (p10th, p9th, etc.) and corresponding JSD values. A question mark and threshold comparison is also present.
### Detailed Analysis or Content Details
The diagram shows the following:
* **Layer Stack:** The stack consists of 10 layers, visually represented as stacked rectangles. The colors of the rectangles transition from dark purple (10th layer) to light blue (1st layer).
* **Probability Distributions:** Histograms are shown for probability distributions labeled p10th, p9th, p8th, p7th, and p1st. The histograms are vertically aligned with their corresponding layers.
* **JSD Values & Threshold Comparison:** Each probability distribution is connected to a JSD value and a checkmark or cross symbol indicating whether the JSD value is less than a threshold. The JSD values are listed as follows:
* JSD(p10th || p7th) = 0.00 (checkmark)
* JSD(p9th || p7th) = 0.08 (checkmark)
* JSD(p8th || p7th) = 0.36 (checkmark)
* JSD(p7th || p7th) = 0.76 (cross)
* JSD(p7th || p7th) = 0.78 (cross)
* JSD(p7th || p7th) = 0.82 (cross)
* JSD(p7th || p7th) = 0.86 (cross)
* JSD(p7th || p7th) = 0.85 (cross)
* JSD(p7th || p7th) = 0.93 (cross)
* JSD(p7th || p7th) = 0.96 (cross)
* **Text Labels:**
* "Model Forward Pass" (top-left)
* "Compute JSD (p10th || p7th) < Threshold ?" (top-right)
* "Deep-Thinking Regime" (left side of layer stack)
* "10-th layer"
* "9-th layer"
* "8-th layer"
* "7-th layer"
* "1-st layer"
### Key Observations
* The JSD values increase as you move down the layers (from 10th to 1st).
* The initial layers (10th, 9th, 8th) have JSD values below the threshold (indicated by checkmarks).
* From the 7th layer onwards, all JSD values are above the threshold (indicated by crosses).
* The JSD values are computed between the probability distribution of a layer and the probability distribution of the 7th layer.
### Interpretation
The diagram illustrates a concept where the "Deep-Thinking Regime" of a model (represented by the layers) undergoes a transformation where the probability distributions diverge as you move deeper into the model. The JSD is used to quantify this divergence. The threshold represents a point where the divergence becomes significant.
The initial layers (10th, 9th, 8th) maintain a relatively similar probability distribution to the 7th layer, as indicated by the low JSD values. However, as you move down to the 7th layer and beyond, the probability distributions become increasingly different, resulting in higher JSD values that exceed the threshold.
This suggests that the 7th layer might be a critical point in the model's processing, where the representation of information begins to significantly change. The diagram implies that the "Deep-Thinking Regime" is effective up to a certain layer (8th layer), after which the model's internal representations diverge from a baseline (represented by the 7th layer). This could be indicative of feature extraction, abstraction, or a shift in the model's focus. The diagram is a visual representation of a process for identifying a point of divergence within a deep learning model.