## Diagram: Deep-Thinking Regime Model Forward Pass with JSD Analysis
### Overview
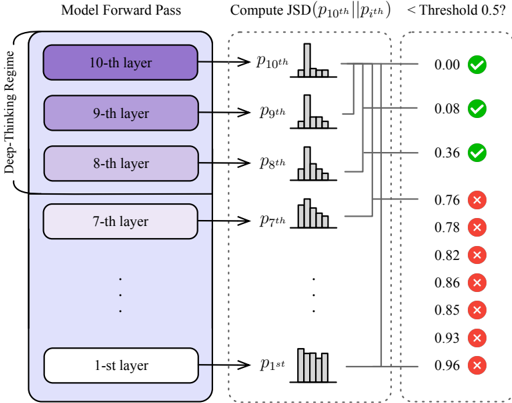
The diagram illustrates a neural network's forward pass through 10 layers (1st to 10th), with probabilistic outputs at each layer. It compares these outputs to a threshold (0.5) using Jensen-Shannon Divergence (JSD) calculations, visually distinguishing layers that meet (<0.5) or exceed (≥0.5) the threshold.
### Components/Axes
1. **Left Panel (Model Forward Pass)**:
- **Layers**: 10 labeled layers (1st to 10th) stacked vertically.
- **Color Coding**:
- 10th, 9th, and 8th layers shaded in purple (highlighted as "Deep-Thinking Regime").
- 7th to 1st layers in gray.
- **Arrows**: Point to probability distributions (`p₁₀ᵗʰ` to `p₁ₛᵗ`) for each layer.
2. **Right Panel (JSD Analysis)**:
- **Threshold**: Vertical dashed line at 0.5.
- **JSD Values**:
- Green checkmarks (✓) for JSD < 0.5 (layers 10th, 9th, 8th).
- Red crosses (✗) for JSD ≥ 0.5 (layers 7th to 1st).
- **Probability Distributions**: Bar charts for `p₁₀ᵗʰ` to `p₁ₛᵗ` with approximate heights indicating output variability.
3. **Legend**:
- Green (✓): JSD < 0.5 (threshold met).
- Red (✗): JSD ≥ 0.5 (threshold exceeded).
### Detailed Analysis
- **Layer 10th**: JSD = 0.00 (✓), indicating minimal divergence from the threshold.
- **Layer 9th**: JSD = 0.08 (✓), slightly higher divergence but still within threshold.
- **Layer 8th**: JSD = 0.36 (✓), moderate divergence but acceptable.
- **Layer 7th**: JSD = 0.76 (✗), significant divergence exceeding threshold.
- **Layer 1st**: JSD = 0.96 (✗), highest divergence, farthest from threshold.
### Key Observations
1. **Threshold Compliance**: Only the top 3 layers (10th, 9th, 8th) meet the JSD threshold, suggesting they align better with the target distribution.
2. **Divergence Trend**: JSD values increase exponentially as layers descend (e.g., 0.36 → 0.76 → 0.96), indicating progressive output instability.
3. **Probability Distributions**: Lower layers (`p₁ₛᵗ`) show broader, flatter distributions compared to sharper peaks in higher layers (`p₁₀ᵗʰ`), correlating with higher JSD.
### Interpretation
- **Model Behavior**: The "Deep-Thinking Regime" (layers 10th–8th) maintains outputs closer to the threshold, implying these layers are more stable or optimized for the task. Lower layers (7th–1st) exhibit chaotic or unrefined outputs, possibly due to insufficient training or architectural limitations.
- **JSD Significance**: JSD measures similarity between distributions. Lower values (green) suggest the model’s outputs at these layers are well-calibrated, while higher values (red) indicate poor calibration or overfitting.
- **Architectural Implications**: The sharp divergence in lower layers may highlight a need for regularization, deeper layer optimization, or revised loss functions to improve overall model reliability.
### Spatial Grounding & Trend Verification
- **Legend Placement**: Bottom-right corner, clearly associating colors with JSD outcomes.
- **Trend Verification**: JSD values increase monotonically from top (0.00) to bottom (0.96), confirming a consistent degradation in output quality as layers descend.