\n
## Bar Chart: F1 Score and BLEU-1 vs. k Values
### Overview
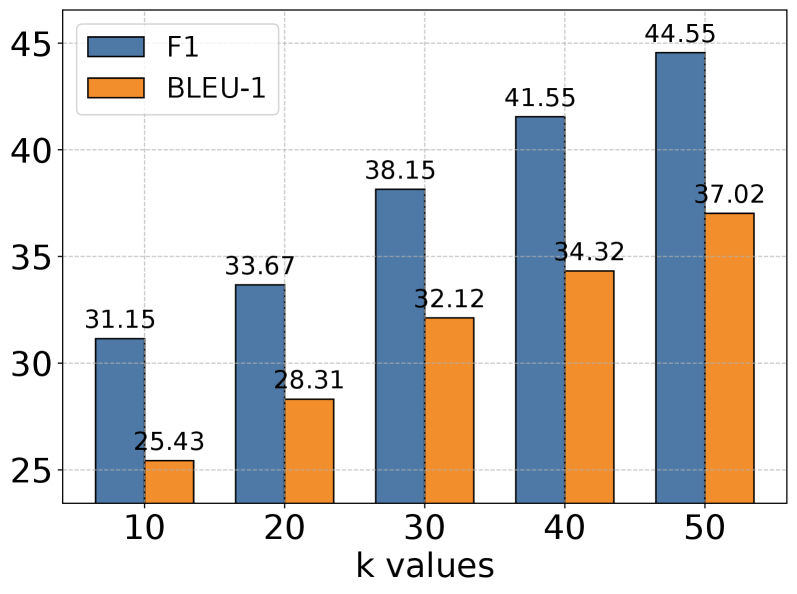
This image presents a bar chart comparing the F1 score and BLEU-1 metric values across different 'k' values. The chart displays these metrics as bar heights for k values ranging from 10 to 50, incrementing by 10. The chart aims to illustrate the relationship between these metrics and the 'k' parameter.
### Components/Axes
* **X-axis:** "k values" - Discrete values: 10, 20, 30, 40, 50.
* **Y-axis:** Scale ranging from approximately 25 to 45. No explicit label is provided, but it represents the metric values.
* **Legend:** Located in the top-left corner.
* Blue bars: "F1"
* Orange bars: "BLEU-1"
### Detailed Analysis
The chart consists of two data series, each represented by a set of bars.
**F1 Score (Blue Bars):**
The F1 score exhibits a generally upward trend as 'k' increases.
* k = 10: F1 = 31.15
* k = 20: F1 = 33.67
* k = 30: F1 = 38.15
* k = 40: F1 = 41.55
* k = 50: F1 = 44.55
**BLEU-1 (Orange Bars):**
The BLEU-1 score also shows an increasing trend with increasing 'k' values, but the rate of increase appears less steep than that of the F1 score.
* k = 10: BLEU-1 = 25.43
* k = 20: BLEU-1 = 28.31
* k = 30: BLEU-1 = 32.12
* k = 40: BLEU-1 = 34.32
* k = 50: BLEU-1 = 37.02
### Key Observations
* The F1 score consistently outperforms the BLEU-1 score across all 'k' values.
* The rate of improvement in F1 score appears to diminish as 'k' increases, particularly between k=40 and k=50.
* The BLEU-1 score shows a more gradual increase across the range of 'k' values.
* The gap between the F1 and BLEU-1 scores widens as 'k' increases.
### Interpretation
The data suggests that increasing the 'k' value generally improves both the F1 score and the BLEU-1 metric. The 'k' parameter likely represents a hyperparameter controlling the number of candidates or options considered in a model or algorithm. The F1 score, which balances precision and recall, appears to be more sensitive to changes in 'k' than the BLEU-1 score, which measures the similarity between generated text and reference text. The diminishing returns observed in the F1 score at higher 'k' values suggest that there may be an optimal 'k' value beyond which further increases provide minimal benefit. The consistent outperformance of F1 over BLEU-1 indicates that the model is achieving better overall performance in terms of both precision and recall, compared to its ability to generate text similar to reference text. The widening gap between the two metrics suggests that as 'k' increases, the model becomes better at correctly identifying relevant information (as reflected in the F1 score) but does not necessarily improve its ability to generate text that closely resembles the reference text (as reflected in the BLEU-1 score).