## Box Plot: Cross-Perplexity
### Overview
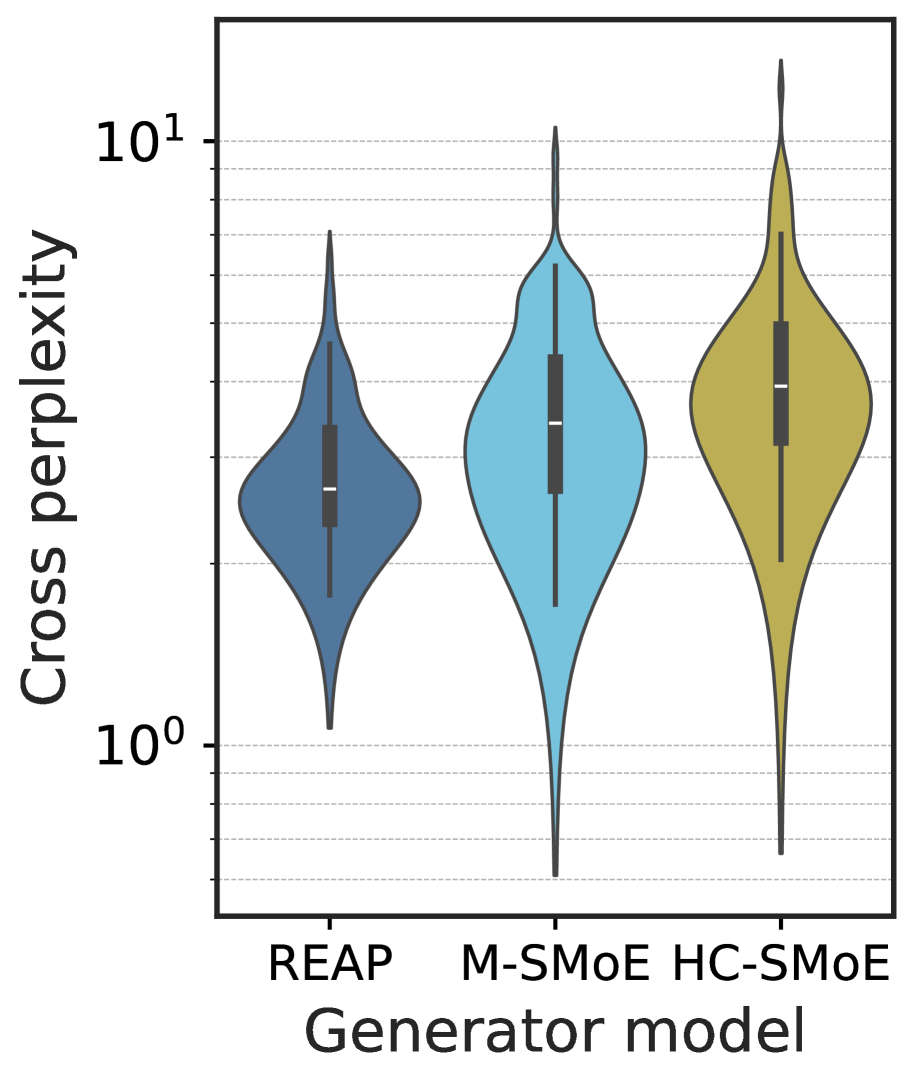
The image displays a box plot comparing the cross-perplexity of three different generator models: REAP, M-SMoE, and HC-SMoE. The plot is designed to show the distribution of cross-perplexity values for each model, with the median, quartiles, and potential outliers represented.
### Components/Axes
- **Y-axis**: Cross-perplexity, measured on a logarithmic scale from 10^0 to 10^1.
- **X-axis**: Generator model, labeled as REAP, M-SMoE, and HC-SMoE.
- **Legend**: The legend is located at the bottom of the plot, indicating the color coding for each model.
- **Box Plot**: Each box plot represents the distribution of cross-perplexity values for a specific model. The boxes show the interquartile range (IQR), the median (line inside the box), and the whiskers extend to the minimum and maximum values within 1.5 times the IQR.
### Detailed Analysis or ### Content Details
- **REAP Model**: The box plot for REAP shows a relatively narrow distribution with a median around 10^0.5. The IQR is smaller, and the whiskers are shorter, indicating less variability and a more consistent performance.
- **M-SMoE Model**: The box plot for M-SMoE has a slightly wider distribution compared to REAP, with a median around 10^0.7. The IQR is larger, and the whiskers are longer, suggesting more variability and potentially better performance.
- **HC-SMoE Model**: The box plot for HC-SMoE is the widest, with a median around 10^0.9. The IQR is the largest, and the whiskers are the longest, indicating the highest variability and potentially the best performance among the three models.
### Key Observations
- **REAP Model**: Shows the least variability and the most consistent performance.
- **M-SMoE Model**: Shows moderate variability and potentially better performance than REAP.
- **HC-SMoE Model**: Shows the highest variability and potentially the best performance.
### Interpretation
The data suggests that the HC-SMoE model has the highest cross-perplexity, indicating it may be less efficient or less effective in generating data compared to REAP and M-SMoE. The REAP model has the lowest cross-perplexity, suggesting it is the most efficient. The M-SMoE model falls in between, showing a balance between efficiency and variability. The wide distribution of the HC-SMoE model indicates that it may be more prone to generating data with a wide range of complexity, which could be a trade-off for its performance.