# Technical Description of the Violin Plot
## Chart Overview
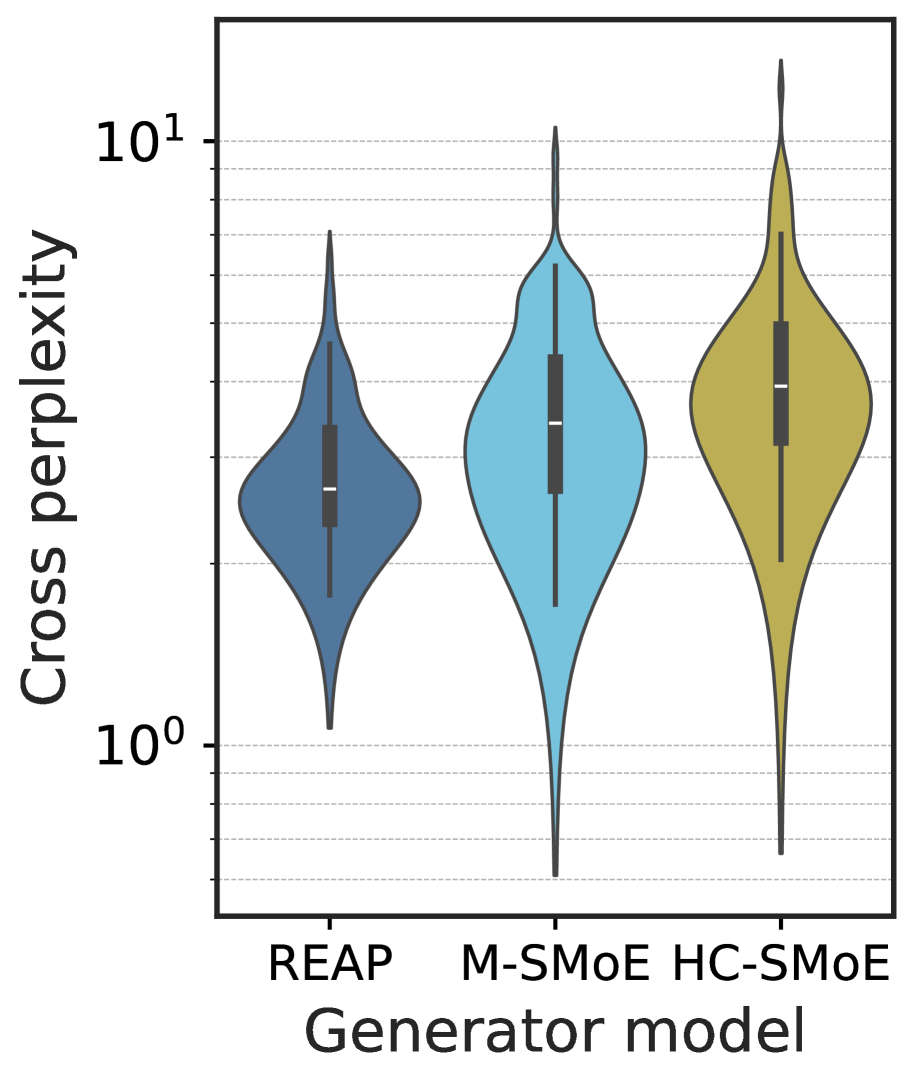
The image is a violin plot comparing the distribution of "Cross perplexity" across three different "Generator model" categories. The plot combines a box plot with a kernel density estimation to show the distribution shape of the data.
## Axes and Labels
* **Y-axis:** The vertical axis is labeled "Cross perplexity". It has a logarithmic scale with major tick marks at **10⁰** and **10¹**. Horizontal gridlines are present at these major ticks and at intermediate logarithmic intervals (e.g., 2, 3, 4, 5, 6, 7, 8, 9, 20, 30, etc., though not explicitly labeled).
* **X-axis:** The horizontal axis is labeled "Generator model". It displays three categorical labels: **REAP**, **M-SMoE**, and **HC-SMoE**.
## Data Analysis by Category
The plot shows three violin shapes, each corresponding to a generator model. Inside each violin is a box plot with a white dot representing the median, a thick bar representing the interquartile range (IQR), and thin lines (whiskers) extending to the rest of the distribution, excluding outliers.
### 1. REAP (Dark Blue Violin)
* **Distribution Shape:** The distribution is relatively narrow and centered at a lower cross perplexity value compared to the other two models.
* **Median:** The median cross perplexity is approximately **2**.
* **Interquartile Range (IQR):** The IQR spans from roughly **1.5** to **3**.
* **Range:** The whiskers extend from a minimum of about **1** to a maximum of about **6**.
### 2. M-SMoE (Light Blue Violin)
* **Distribution Shape:** The distribution is wider than REAP and centered at a higher value. It shows a broader range of cross perplexity values.
* **Median:** The median cross perplexity is approximately **3**.
* **Interquartile Range (IQR):** The IQR spans from roughly **2** to **5**.
* **Range:** The whiskers extend from a minimum of about **0.6** to a maximum of about **10**.
### 3. HC-SMoE (Gold/Yellow Violin)
* **Distribution Shape:** The distribution is similar in width to M-SMoE but is centered at a slightly higher value.
* **Median:** The median cross perplexity is approximately **3.5**.
* **Interquartile Range (IQR):** The IQR spans from roughly **2.5** to **6**.
* **Range:** The whiskers extend from a minimum of about **0.7** to a maximum of about **15**.
## Key Trends
* **Median Cross Perplexity:** The median cross perplexity increases in the order: REAP < M-SMoE < HC-SMoE.
* **Distribution Spread:** REAP has the narrowest distribution of cross perplexity values, indicating more consistent performance. M-SMoE and HC-SMoE have wider distributions, showing greater variability in their cross perplexity.
* **Overall Range:** HC-SMoE has the highest maximum cross perplexity value, while M-SMoE has the lowest minimum value. REAP's range is the most contained.