# Technical Document Extraction: Cross Perplexity Analysis of Generator Models
## Figure Description
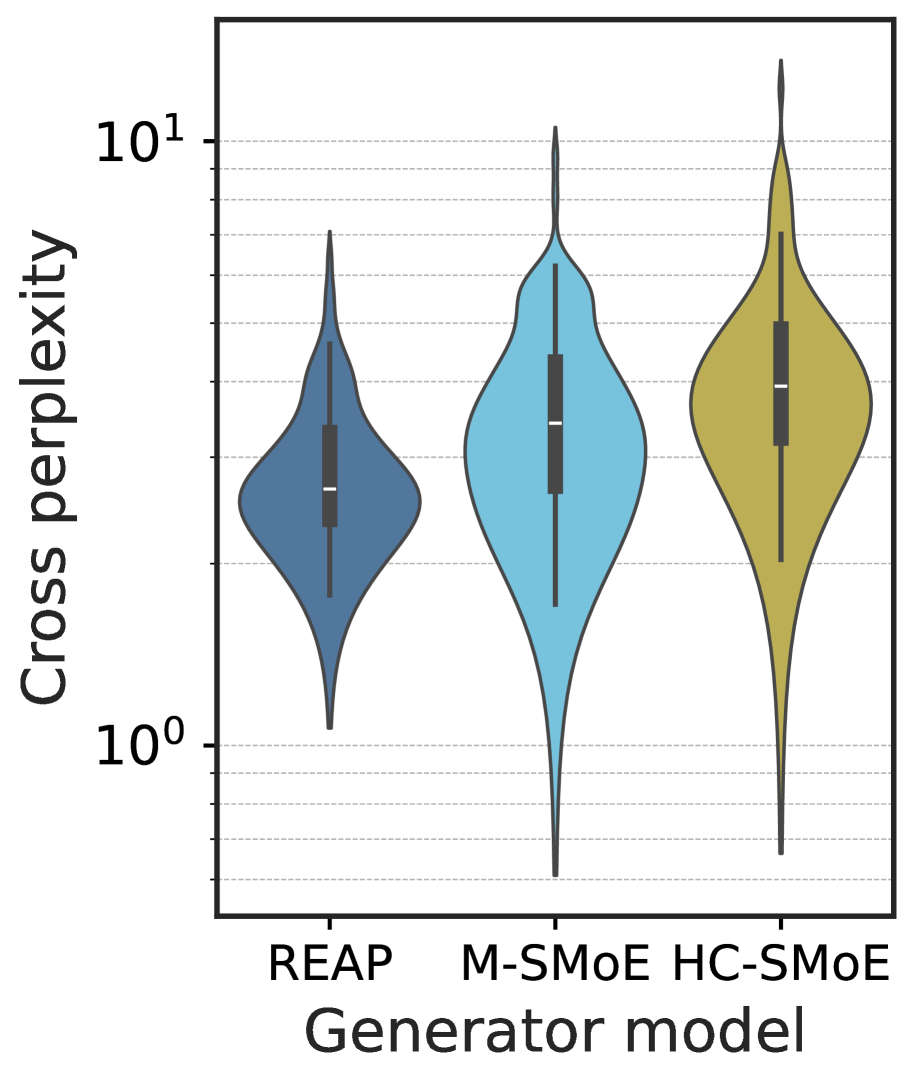
This image presents a comparative analysis of **cross perplexity** across three generator models using violin plots. The data is visualized on a logarithmic scale (base 10) to emphasize distributional differences.
---
### **Key Components**
1. **Axes**
- **Y-axis**: Labeled "Cross perplexity" with logarithmic scaling (10⁰ to 10¹). Dashed horizontal lines mark 10⁰ and 10¹.
- **X-axis**: Categorizes generator models:
- REAP (dark blue)
- M-SMoE (teal)
- HC-SMoE (olive)
2. **Violin Plot Structure**
- **Shapes**: Each violin represents the probability density of cross perplexity values for a model.
- **Width**: Indicates density of data points at specific perplexity levels.
- **Tails**: Extend to show minimum/maximum values (e.g., HC-SMoE has the longest upper tail).
- **Black Lines**: Represent the **interquartile range (IQR)**.
- **White Lines**: Denote the **median** value within the IQR.
---
### **Key Trends and Data Points**
1. **Model Performance**
- **HC-SMoE**:
- Highest median perplexity (~10⁰.⁵).
- Widest IQR (indicating greater variability in results).
- Longest upper tail (outliers up to ~10¹).
- **M-SMoE**:
- Median ~10⁰.⁴.
- Moderate IQR and tail spread.
- **REAP**:
- Lowest median (~10⁰.³).
- Narrowest IQR (most consistent performance).
- Shortest tails (least extreme values).
2. **Logarithmic Scale Implications**
- Differences in medians and spreads are amplified due to the log scale.
- HC-SMoE’s performance is notably worse than REAP by an order of magnitude in upper tail values.
---
### **Critical Observations**
- **REAP** demonstrates the most stable and lowest perplexity, suggesting superior generalization.
- **HC-SMoE** exhibits the highest variability and worst-case performance, despite potential advantages in other metrics.
- **M-SMoE** balances performance and variability but underperforms REAP in median perplexity.
---
### **Technical Notes**
- No explicit legend is present; model identities are inferred from x-axis labels and color coding.
- All violins share identical axis scaling, enabling direct comparison.
- The absence of numerical annotations on the violins limits precise quantification of IQR/median values.
---
This visualization highlights trade-offs between model complexity (e.g., HC-SMoE’s higher capacity) and performance stability (REAP’s consistency). Further analysis could explore why HC-SMoE exhibits such variability despite its architectural sophistication.