## Bar Chart: Throughput Comparison Across Caching Strategies and Models
### Overview
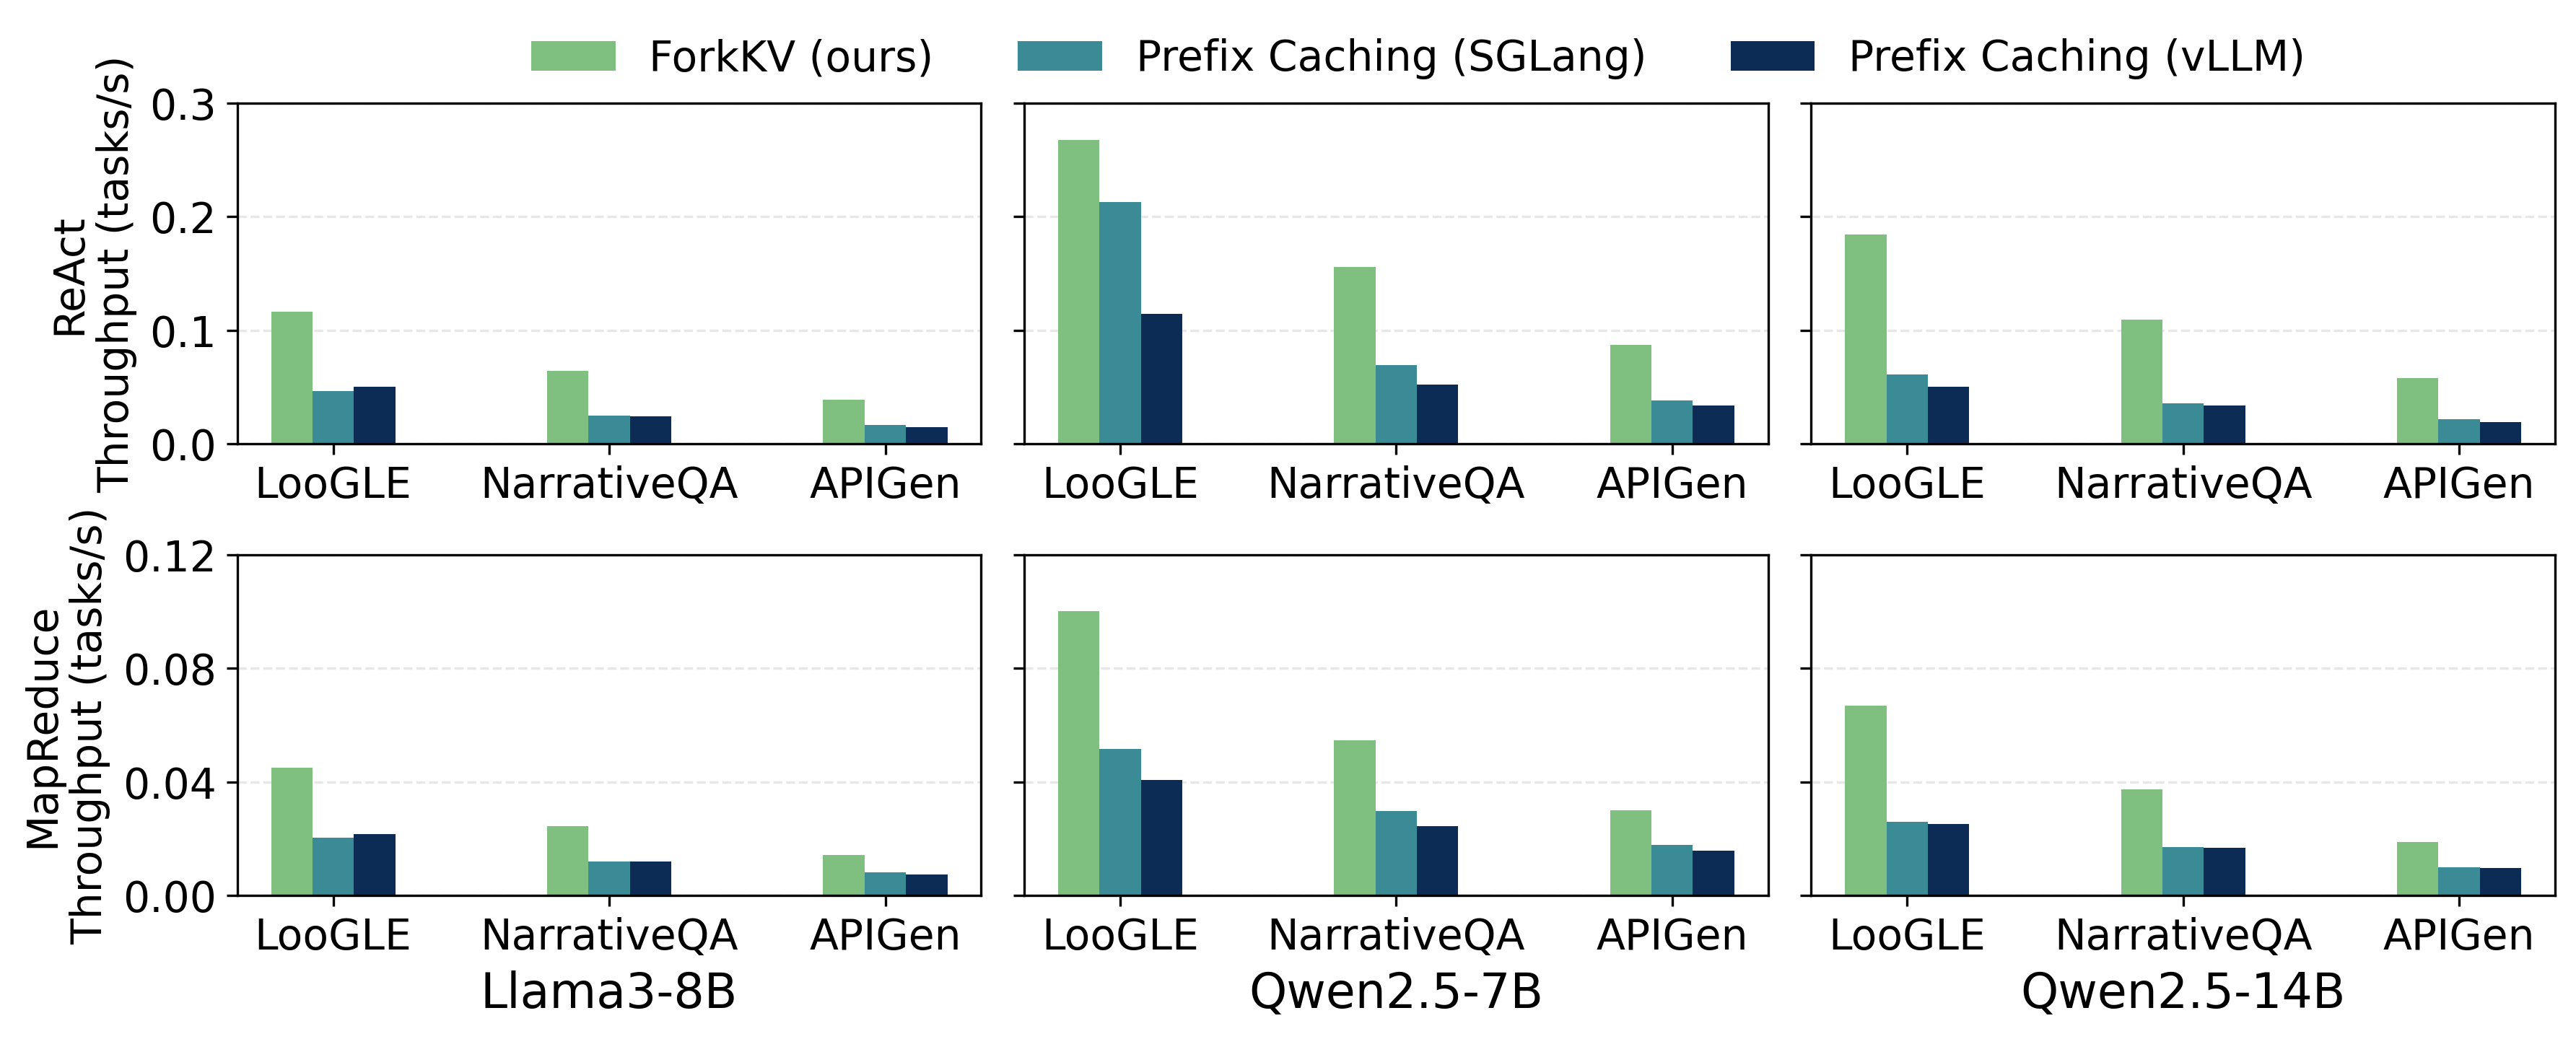
The image contains six grouped bar charts comparing throughput (tasks/s) for three caching strategies (ForkKV, Prefix Caching with SGLang, Prefix Caching with vLLM) across six task-model combinations. The charts are divided into two sections: "React" (top row) and "MapReduce" (bottom row), with three models (LooGLE, NarrativeQA, APIGen) and three base models (Llama3-8B, Qwen2.5-7B, Qwen2.5-14B) as subcategories.
### Components/Axes
- **X-axis**: Task categories (LooGLE, NarrativeQA, APIGen)
- **Y-axis**: Throughput (tasks/s) with two subplots:
- Top: React throughput
- Bottom: MapReduce throughput
- **Legends**:
- Green: ForkKV (ours)
- Teal: Prefix Caching (SGLang)
- Dark Blue: Prefix Caching (vLLM)
- **Subheadings**: Model variants (Llama3-8B, Qwen2.5-7B, Qwen2.5-14B) positioned above each chart
### Detailed Analysis
#### React Throughput (Top Row)
1. **Llama3-8B**:
- ForkKV: ~0.12 tasks/s
- SGLang: ~0.06 tasks/s
- vLLM: ~0.05 tasks/s
2. **NarrativeQA**:
- ForkKV: ~0.08 tasks/s
- SGLang: ~0.04 tasks/s
- vLLM: ~0.03 tasks/s
3. **APIGen**:
- ForkKV: ~0.05 tasks/s
- SGLang: ~0.03 tasks/s
- vLLM: ~0.02 tasks/s
#### MapReduce Throughput (Bottom Row)
1. **Llama3-8B**:
- ForkKV: ~0.04 tasks/s
- SGLang: ~0.02 tasks/s
- vLLM: ~0.01 tasks/s
2. **NarrativeQA**:
- ForkKV: ~0.06 tasks/s
- SGLang: ~0.03 tasks/s
- vLLM: ~0.02 tasks/s
3. **APIGen**:
- ForkKV: ~0.03 tasks/s
- SGLang: ~0.01 tasks/s
- vLLM: ~0.005 tasks/s
#### Qwen2.5-7B (Middle Column)
- React:
- ForkKV: ~0.15 tasks/s
- SGLang: ~0.09 tasks/s
- vLLM: ~0.07 tasks/s
- MapReduce:
- ForkKV: ~0.07 tasks/s
- SGLang: ~0.04 tasks/s
- vLLM: ~0.03 tasks/s
#### Qwen2.5-14B (Right Column)
- React:
- ForkKV: ~0.18 tasks/s
- SGLang: ~0.07 tasks/s
- vLLM: ~0.06 tasks/s
- MapReduce:
- ForkKV: ~0.05 tasks/s
- SGLang: ~0.03 tasks/s
- vLLM: ~0.02 tasks/s
### Key Observations
1. **ForkKV Dominance**: Consistently outperforms both Prefix Caching methods across all tasks and models.
2. **Model Size Impact**: Larger models (Qwen2.5-14B) show higher absolute throughput than smaller models (Llama3-8B).
3. **Task Dependency**: React tasks generally achieve higher throughput than MapReduce tasks for the same model.
4. **Caching Strategy Tradeoffs**:
- SGLang outperforms vLLM in React for Qwen2.5-7B (0.09 vs 0.07)
- vLLM shows better MapReduce performance for Qwen2.5-14B (0.02 vs 0.01)
### Interpretation
The data suggests ForkKV's architecture provides superior throughput across all scenarios, likely due to its optimized design. Prefix Caching performance varies significantly by model size and task type:
- **SGLang** excels in React tasks with mid-sized models (Qwen2.5-7B)
- **vLLM** shows unexpected MapReduce efficiency with the largest model (Qwen2.5-14B)
- The 3x throughput gap between React and MapReduce tasks for ForkKV indicates task-specific optimizations in the framework.
These results highlight the importance of caching strategy selection based on both model architecture and task requirements, with ForkKV emerging as the most universally effective solution in this comparison.