## Bar Chart: Accuracy vs. Pass@1 of qτ
### Overview
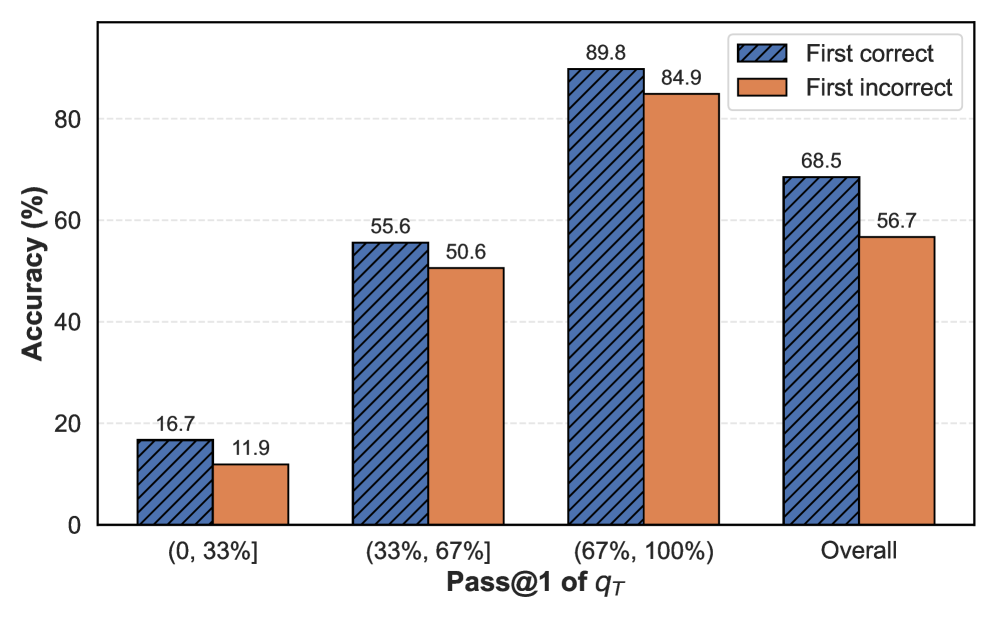
This bar chart compares the accuracy of "First correct" and "First incorrect" predictions across different ranges of Pass@1 of qτ. Pass@1 of qτ is represented on the x-axis, and Accuracy (%) is represented on the y-axis. The chart displays accuracy for both correct and incorrect first predictions for three specific ranges of Pass@1 of qτ, as well as an overall accuracy.
### Components/Axes
* **X-axis:** Pass@1 of qτ, with categories: (0, 33%], (33%, 67%], (67%, 100%), and Overall.
* **Y-axis:** Accuracy (%), ranging from 0 to 90, with increments of 10.
* **Legend:** Located in the top-right corner.
* "First correct" - represented by a dark blue color with a diagonal hatch pattern.
* "First incorrect" - represented by a light orange color with a diagonal hatch pattern.
### Detailed Analysis
The chart consists of paired bars for each Pass@1 of qτ category, representing the accuracy of the first correct and first incorrect predictions.
* **(0, 33%]**:
* First correct: Approximately 16.7% accuracy. (Dark Blue Bar)
* First incorrect: Approximately 11.9% accuracy. (Orange Bar)
* **(33%, 67%]**:
* First correct: Approximately 55.6% accuracy. (Dark Blue Bar)
* First incorrect: Approximately 50.6% accuracy. (Orange Bar)
* **(67%, 100%]**:
* First correct: Approximately 89.8% accuracy. (Dark Blue Bar)
* First incorrect: Approximately 84.9% accuracy. (Orange Bar)
* **Overall**:
* First correct: Approximately 68.5% accuracy. (Dark Blue Bar)
* First incorrect: Approximately 56.7% accuracy. (Orange Bar)
The "First correct" bars are consistently higher than the "First incorrect" bars across all categories. The trend shows that as Pass@1 of qτ increases, the accuracy of "First correct" predictions also increases significantly.
### Key Observations
* The accuracy gap between "First correct" and "First incorrect" is most pronounced in the (67%, 100%] Pass@1 of qτ range.
* The overall accuracy for "First correct" is 68.5%, while for "First incorrect" it is 56.7%.
* The lowest accuracy values are observed in the (0, 33%] Pass@1 of qτ range.
### Interpretation
The data suggests a strong positive correlation between Pass@1 of qτ and the accuracy of the first correct prediction. Higher values of Pass@1 of qτ indicate a higher probability of selecting the correct answer as the first attempt, leading to significantly improved accuracy. The consistent outperformance of "First correct" over "First incorrect" indicates that the model is more likely to identify the correct answer when it has a higher confidence level (as reflected by Pass@1 of qτ). The overall accuracy values provide a general performance benchmark, while the category-specific data reveals how performance varies across different confidence levels. The large jump in accuracy between the (33%, 67%] and (67%, 100%] ranges suggests a threshold effect, where exceeding a certain confidence level dramatically improves prediction accuracy. This could be due to the model's internal decision-making process, where a higher confidence score triggers a more reliable prediction mechanism.