\n
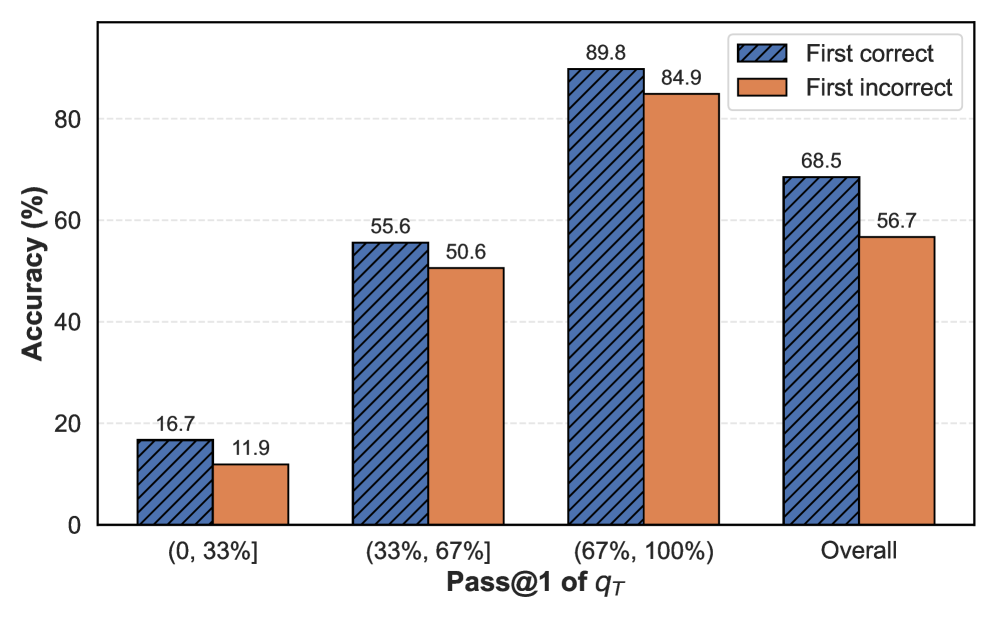
## Grouped Bar Chart: Accuracy by Pass@1 of q_T
### Overview
This is a grouped bar chart comparing the accuracy percentage (y-axis) of two conditions—"First correct" and "First incorrect"—across four categories defined by the "Pass@1 of q_T" metric (x-axis). The chart demonstrates how accuracy varies with the Pass@1 score and differs between the two conditions.
### Components/Axes
* **Chart Type:** Grouped vertical bar chart.
* **Y-Axis:**
* **Label:** "Accuracy (%)"
* **Scale:** Linear scale from 0 to approximately 90, with major gridlines at intervals of 20 (0, 20, 40, 60, 80).
* **X-Axis:**
* **Label:** "Pass@1 of q_T"
* **Categories (from left to right):**
1. `(0, 33%]`
2. `(33%, 67%]`
3. `(67%, 100%)`
4. `Overall`
* **Legend:**
* **Position:** Top-right corner of the chart area.
* **Entry 1:** "First correct" - Represented by a blue bar with diagonal hatching (stripes running from top-left to bottom-right).
* **Entry 2:** "First incorrect" - Represented by a solid orange bar.
### Detailed Analysis
The chart presents paired data for each of the four x-axis categories. The values are displayed as data labels on top of each bar.
**1. Category: (0, 33%]**
* **First correct (Blue, hatched):** 16.7%
* **First incorrect (Orange, solid):** 11.9%
* **Trend:** This category has the lowest accuracy for both conditions. The "First correct" condition is 4.8 percentage points higher than "First incorrect."
**2. Category: (33%, 67%]**
* **First correct (Blue, hatched):** 55.6%
* **First incorrect (Orange, solid):** 50.6%
* **Trend:** A significant increase in accuracy for both conditions compared to the first category. "First correct" remains higher by 5.0 percentage points.
**3. Category: (67%, 100%)**
* **First correct (Blue, hatched):** 89.8%
* **First incorrect (Orange, solid):** 84.9%
* **Trend:** This category shows the highest accuracy for both conditions. The gap between the two conditions is 4.9 percentage points.
**4. Category: Overall**
* **First correct (Blue, hatched):** 68.5%
* **First incorrect (Orange, solid):** 56.7%
* **Trend:** This represents the aggregate performance. The "First correct" condition outperforms "First incorrect" by a substantial margin of 11.8 percentage points.
### Key Observations
1. **Consistent Performance Gap:** In every category, the "First correct" condition yields higher accuracy than the "First incorrect" condition. The gap is relatively consistent (~5 percentage points) within the three specific Pass@1 ranges but widens significantly in the "Overall" aggregate.
2. **Positive Correlation with Pass@1:** There is a clear, strong positive trend: as the Pass@1 of q_T increases (moving from left to right on the x-axis), the accuracy for both conditions increases dramatically.
3. **Highest and Lowest Points:** The highest accuracy is 89.8% for "First correct" in the (67%, 100%) range. The lowest accuracy is 11.9% for "First incorrect" in the (0, 33%] range.
4. **Overall Performance:** The "Overall" accuracy for "First correct" (68.5%) is higher than the accuracy for the middle category (33%, 67%], suggesting the dataset may be weighted toward higher Pass@1 scores.
### Interpretation
The data suggests a strong relationship between the Pass@1 metric of q_T and the system's accuracy. A higher Pass@1 score is a reliable predictor of higher accuracy, regardless of whether the first attempt was correct or incorrect.
The consistent advantage of the "First correct" condition implies that an initial correct answer has a positive carry-over effect, leading to better overall performance on subsequent tasks or evaluations within the same context. This could indicate a "confidence" or "momentum" effect in the model's reasoning process.
The significant widening of the performance gap in the "Overall" metric (11.8 points vs. ~5 points in the binned categories) is a key finding. It suggests that the benefits of a correct first attempt are not uniform but are particularly pronounced when aggregated across all difficulty levels (as represented by the Pass@1 ranges). This could mean that for easier problems (high Pass@1), the first attempt's correctness matters less, but for the full spectrum of problems, it becomes a major differentiating factor.
**Potential Anomaly/Note:** The "Overall" accuracy for "First correct" (68.5%) is notably higher than the accuracy for the (33%, 67%] bin (55.6%). This is mathematically possible only if a large proportion of the test samples fall into the highest-performing (67%, 100%) bin, pulling the weighted average up. This indicates the evaluation dataset is skewed towards questions where the model has a high Pass@1 probability.