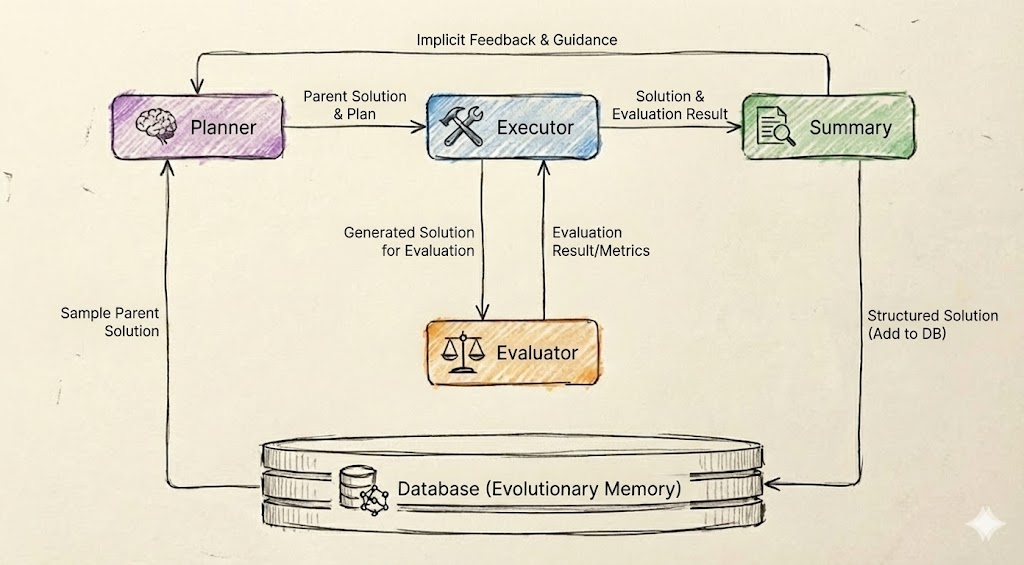
## Flowchart: Iterative Problem-Solving Process with Evolutionary Memory
### Overview
The diagram illustrates a cyclical process for generating, evaluating, and refining solutions using a feedback-driven workflow. It includes five core components: Planner, Executor, Evaluator, Summary, and a Database (Evolutionary Memory). Arrows represent data flow and feedback loops, with color-coded elements for clarity.
---
### Components/Axes
1. **Planner** (Purple box with brain icon):
- Receives "Implicit Feedback & Guidance" from the Summary.
- Outputs "Parent Solution & Plan" to the Executor.
- Receives "Sample Parent Solution" from the Database.
2. **Executor** (Blue box with hammer/wrench icon):
- Takes "Parent Solution & Plan" from the Planner.
- Outputs "Generated Solution for Evaluation" to the Evaluator.
3. **Evaluator** (Orange box with scales icon):
- Receives "Generated Solution for Evaluation" from the Executor.
- Outputs "Evaluation Result/Metrics" to the Summary.
4. **Summary** (Green box with document icon):
- Takes "Solution & Evaluation Result" from the Evaluator.
- Outputs "Structured Solution (Add to DB)" to the Database.
- Provides "Implicit Feedback & Guidance" to the Planner.
5. **Database (Evolutionary Memory)** (Gray cylinder with DNA icon):
- Stores "Sample Parent Solution" and "Structured Solution (Add to DB)."
**Legend**:
- Purple = Planner
- Blue = Executor
- Orange = Evaluator
- Green = Summary
- Gray = Database
---
### Detailed Analysis
- **Flow Direction**:
1. Planner → Executor → Evaluator → Summary → Database.
2. Feedback loop: Summary → Planner (via "Implicit Feedback & Guidance").
3. Database feeds "Sample Parent Solution" back to the Planner.
- **Key Text Labels**:
- Arrows:
- "Parent Solution & Plan" (Planner → Executor)
- "Generated Solution for Evaluation" (Executor → Evaluator)
- "Evaluation Result/Metrics" (Evaluator → Summary)
- "Structured Solution (Add to DB)" (Summary → Database)
- "Implicit Feedback & Guidance" (Summary → Planner)
- "Sample Parent Solution" (Database → Planner)
- **Color Consistency**:
All components match their legend colors (e.g., Planner = purple, Evaluator = orange).
---
### Key Observations
1. **Cyclical Nature**: The process is iterative, with feedback from the Summary refining future plans.
2. **Evaluation-Centric**: The Evaluator’s output ("Evaluation Result/Metrics") directly informs the Summary, ensuring quality control.
3. **Memory Integration**: The Database acts as a repository for past solutions, enabling the Planner to leverage historical data.
4. **Modular Design**: Each component has a distinct role, reducing complexity and enabling scalability.
---
### Interpretation
This flowchart represents an **evolutionary problem-solving framework** where:
- **Planning** is informed by both new feedback and historical data (Database).
- **Execution** generates solutions based on current plans.
- **Evaluation** ensures solutions meet predefined metrics before being archived.
- **Summarization** synthesizes results into actionable insights, closing the loop by guiding future iterations.
The **Database (Evolutionary Memory)** is critical for avoiding redundant efforts and accelerating convergence toward optimal solutions. The feedback loop ensures adaptability, while modular components allow for parallel processing or distributed implementation.
**Notable Patterns**:
- The absence of explicit termination conditions suggests the process is designed for continuous improvement.
- The "Implicit Feedback & Guidance" implies qualitative or heuristic inputs, not just quantitative metrics.
This structure aligns with principles of **evolutionary algorithms** and **knowledge management systems**, emphasizing iterative refinement and institutional memory.