## Diagram Type: Flowchart
### Overview
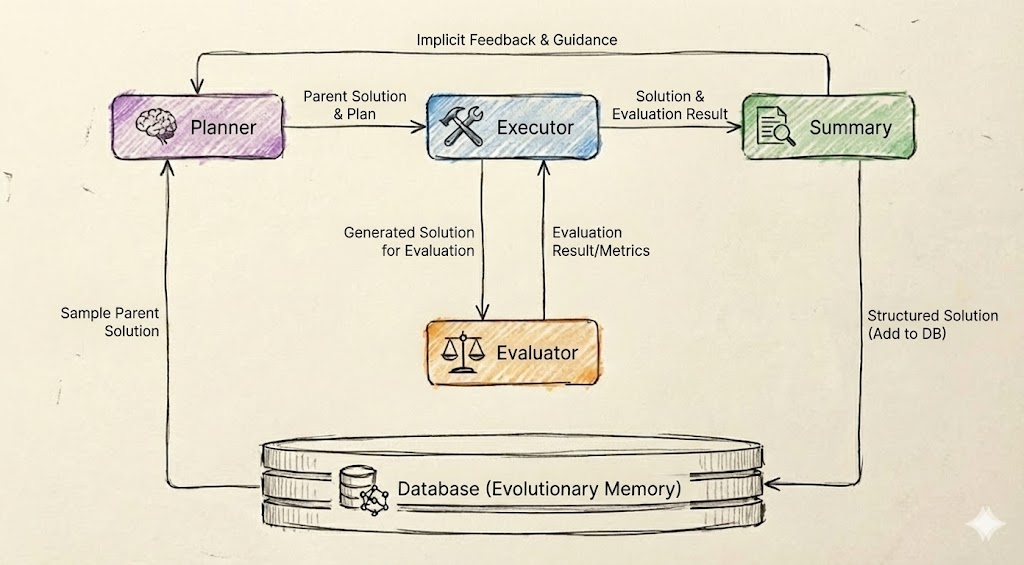
The image is a flowchart that illustrates a process involving a planner, executor, evaluator, and a database. The flowchart is labeled "Implicit Feedback & Guidance" at the top.
### Components/Axes
- **Planner**: Represented by a brain icon, this is the starting point of the process.
- **Executor**: Represented by a wrench icon, this is the next step after the planner.
- **Evaluator**: Represented by a scale icon, this is the step where the solution is evaluated.
- **Summary**: Represented by a document icon, this is the final step where the summary of the process is provided.
- **Database (Evolutionary Memory)**: Represented by a stack of coins, this is the storage area for the process data.
### Detailed Analysis or ### Content Details
- The planner generates a parent solution and plan.
- The executor implements the solution and evaluates the results.
- The evaluator assesses the evaluation results and metrics.
- The summary is created based on the evaluation results.
- The structured solution is added to the database.
### Key Observations
- The flowchart shows a cyclical process where the planner generates a solution, the executor implements it, the evaluator evaluates it, and the summary is created.
- The database is used to store the process data, indicating that the process is being tracked and analyzed over time.
### Interpretation
The flowchart suggests a structured approach to problem-solving and decision-making. The planner generates a plan, the executor implements it, the evaluator assesses the results, and the summary is created. The database is used to store the process data, indicating that the process is being tracked and analyzed over time. This approach ensures that the process is systematic and that the results are documented for future reference.