\n
## Line Chart: Cost per Sequence vs. Training Progress for Neural Network Architectures
### Overview
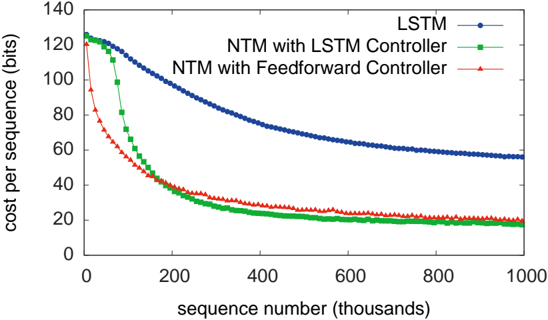
The image is a line chart comparing the training performance of three different neural network architectures. The chart plots the "cost per sequence" (a measure of error or loss) against the number of training sequences processed. The data shows that all models improve (cost decreases) with training, but at significantly different rates and to different final levels.
### Components/Axes
* **Chart Type:** Line chart with markers.
* **X-Axis:**
* **Label:** `sequence number (thousands)`
* **Scale:** Linear, from 0 to 1000 (representing 0 to 1,000,000 training sequences).
* **Major Ticks:** 0, 200, 400, 600, 800, 1000.
* **Y-Axis:**
* **Label:** `cost per sequence (bits)`
* **Scale:** Linear, from 0 to 140.
* **Major Ticks:** 0, 20, 40, 60, 80, 100, 120, 140.
* **Legend:** Located in the top-right corner of the plot area. It contains three entries:
1. `LSTM` - Represented by a blue line with circular markers.
2. `NTM with LSTM Controller` - Represented by a green line with square markers.
3. `NTM with Feedforward Controller` - Represented by a red line with triangular markers.
### Detailed Analysis
**1. LSTM (Blue Line, Circles):**
* **Trend:** Shows a steady, gradual decline. It has the slowest rate of improvement.
* **Data Points (Approximate):**
* Starts at ~125 bits at 0 sequences.
* At 200k sequences: ~100 bits.
* At 400k sequences: ~75 bits.
* At 600k sequences: ~65 bits.
* At 800k sequences: ~60 bits.
* Ends at ~55 bits at 1000k sequences.
**2. NTM with LSTM Controller (Green Line, Squares):**
* **Trend:** Exhibits a very steep initial decline, followed by a rapid plateau. It converges to the lowest final cost.
* **Data Points (Approximate):**
* Starts at ~125 bits at 0 sequences (similar to LSTM).
* At 100k sequences: ~80 bits (already significantly lower than LSTM).
* At 200k sequences: ~40 bits.
* At 400k sequences: ~25 bits.
* From 600k to 1000k sequences: Plateaus around 20 bits.
**3. NTM with Feedforward Controller (Red Line, Triangles):**
* **Trend:** Shows the fastest initial drop in cost, then converges to a level slightly above the green line.
* **Data Points (Approximate):**
* Starts lower than the others, at ~95 bits at 0 sequences.
* At 100k sequences: ~50 bits.
* At 200k sequences: ~35 bits.
* At 400k sequences: ~25 bits (very close to the green line here).
* From 600k to 1000k sequences: Plateaus around 22-25 bits, consistently a few bits higher than the green line.
### Key Observations
1. **Performance Hierarchy:** Both Neural Turing Machine (NTM) variants dramatically outperform the standard LSTM on this task, achieving much lower cost.
2. **Convergence Speed:** The NTM models converge to a low error state within the first 200,000-400,000 sequences, while the LSTM is still improving slowly at 1,000,000 sequences.
3. **Controller Comparison:** The NTM with a Feedforward Controller learns the fastest initially (lowest cost at 100k sequences). However, the NTM with an LSTM Controller ultimately achieves a marginally better (lower) final cost.
4. **Final Plateau:** After approximately 600,000 sequences, all three models show minimal further improvement, indicating they have likely reached their performance capacity for this task.
### Interpretation
This chart demonstrates the superior efficiency of memory-augmented neural networks (the NTM architectures) over a standard recurrent network (LSTM) for the specific sequential task being measured. The "cost per sequence (bits)" likely represents the information-theoretic cost of the model's predictions; lower is better.
The key insight is that **providing the model with an external memory matrix (the core of the NTM) leads to faster learning and better final performance.** The choice of controller (LSTM vs. Feedforward) within the NTM framework affects the learning dynamics: a more complex LSTM controller may enable slightly better final optimization, while a simpler Feedforward controller enables faster initial learning. The fact that both NTM lines converge to a similar low cost suggests the memory mechanism itself is the primary driver of improvement, not the controller's complexity. The LSTM's slow, steady decline suggests it is learning the task through its recurrent weights alone, a less efficient method for this problem.