## Histogram: Steps to KL-based Threshold by Category
### Overview
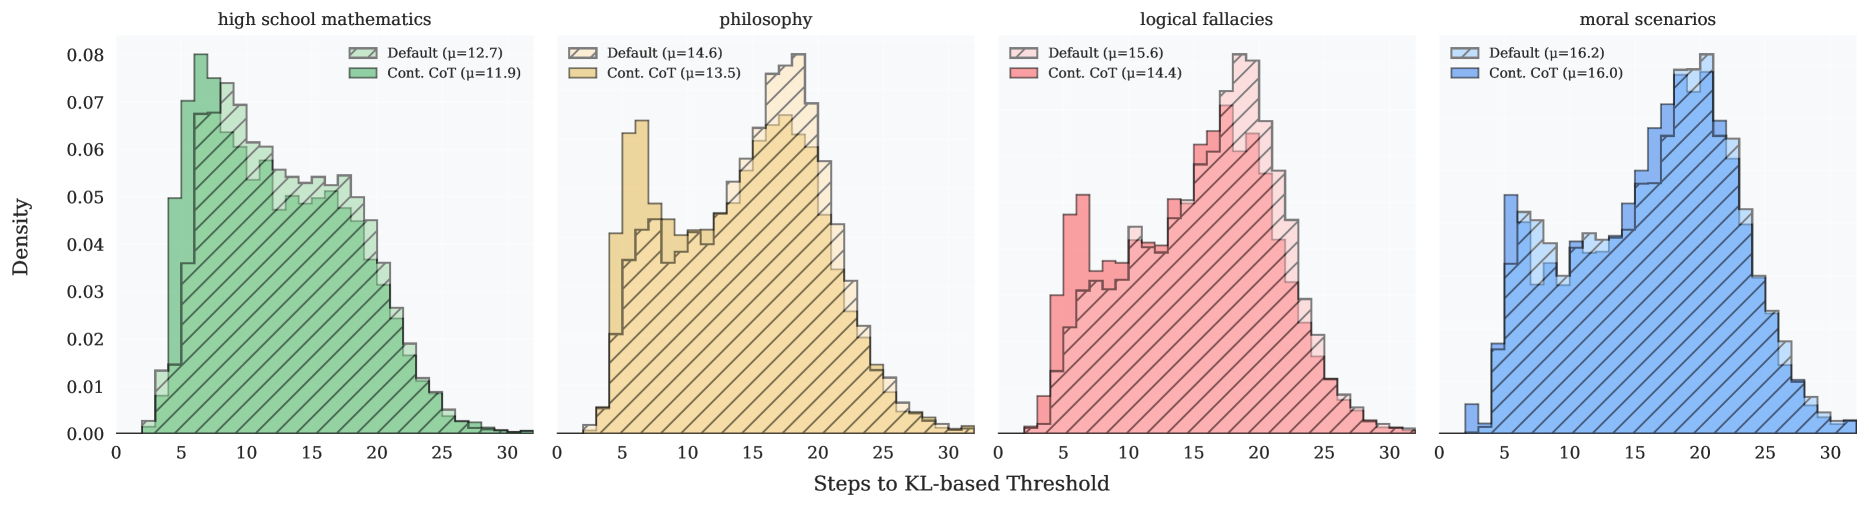
The image presents four histograms, each displaying the distribution of "Steps to KL-based Threshold" for different categories: "high school mathematics", "philosophy", "logical fallacies", and "moral scenarios". Each histogram compares a "Default" setting with a "Cont. CoT" (Continuous Chain-of-Thought) setting. The y-axis represents "Density", and the x-axis represents "Steps to KL-based Threshold".
### Components/Axes
* **X-axis:** "Steps to KL-based Threshold", ranging from 0 to 30 in each histogram.
* **Y-axis:** "Density", ranging from 0.00 to 0.08.
* **Histograms:** Four histograms, one for each category:
* High school mathematics
* Philosophy
* Logical fallacies
* Moral scenarios
* **Legend:** Located at the top of each histogram.
* "Default": Represented by a light gray color with black outlines.
* "Cont. CoT": Represented by a distinct color for each category (green, yellow, red, blue).
* **Mean (µ) values:** Provided in the legend for both "Default" and "Cont. CoT" settings within each category.
### Detailed Analysis
**1. High School Mathematics**
* **Default (µ=12.7):** The light gray histogram shows a distribution that peaks around 5-10 steps and then gradually decreases.
* **Cont. CoT (µ=11.9):** The green histogram shows a similar distribution to the default, peaking around 5 steps and then decreasing.
* **Trend:** Both distributions are right-skewed, with the Cont. CoT slightly shifted to the left compared to the Default.
**2. Philosophy**
* **Default (µ=14.6):** The light gray histogram shows a distribution that peaks around 10-15 steps and then gradually decreases.
* **Cont. CoT (µ=13.5):** The yellow histogram shows a similar distribution to the default, peaking around 10 steps and then decreasing.
* **Trend:** Both distributions are right-skewed, with the Cont. CoT slightly shifted to the left compared to the Default.
**3. Logical Fallacies**
* **Default (µ=15.6):** The light gray histogram shows a distribution that peaks around 10-15 steps and then gradually decreases.
* **Cont. CoT (µ=14.4):** The red histogram shows a similar distribution to the default, peaking around 10 steps and then decreasing.
* **Trend:** Both distributions are right-skewed, with the Cont. CoT slightly shifted to the left compared to the Default.
**4. Moral Scenarios**
* **Default (µ=16.2):** The light gray histogram shows a distribution that peaks around 20-25 steps.
* **Cont. CoT (µ=16.0):** The blue histogram shows a similar distribution to the default, peaking around 20 steps.
* **Trend:** The distributions are less skewed compared to the other categories, with a more pronounced peak.
### Key Observations
* For all categories, the "Cont. CoT" setting has a lower mean (µ) value than the "Default" setting.
* The distributions for "high school mathematics", "philosophy", and "logical fallacies" are right-skewed, indicating that most cases require fewer steps to reach the KL-based threshold.
* The distribution for "moral scenarios" is less skewed and has a more pronounced peak, suggesting a more consistent number of steps required.
### Interpretation
The histograms compare the number of steps required to reach a KL-based threshold under "Default" conditions versus using a "Continuous Chain-of-Thought" (Cont. CoT) approach across four different categories. The consistent trend of lower mean values for "Cont. CoT" suggests that this method generally reduces the number of steps needed to reach the threshold, potentially indicating a more efficient or direct path to the solution or conclusion. The varying shapes of the distributions across categories suggest that the nature of the problem influences the number of steps required, with "moral scenarios" showing a more consistent step count compared to the other, more skewed distributions.