\n
## Histograms: Density Distributions for Different Scenarios
### Overview
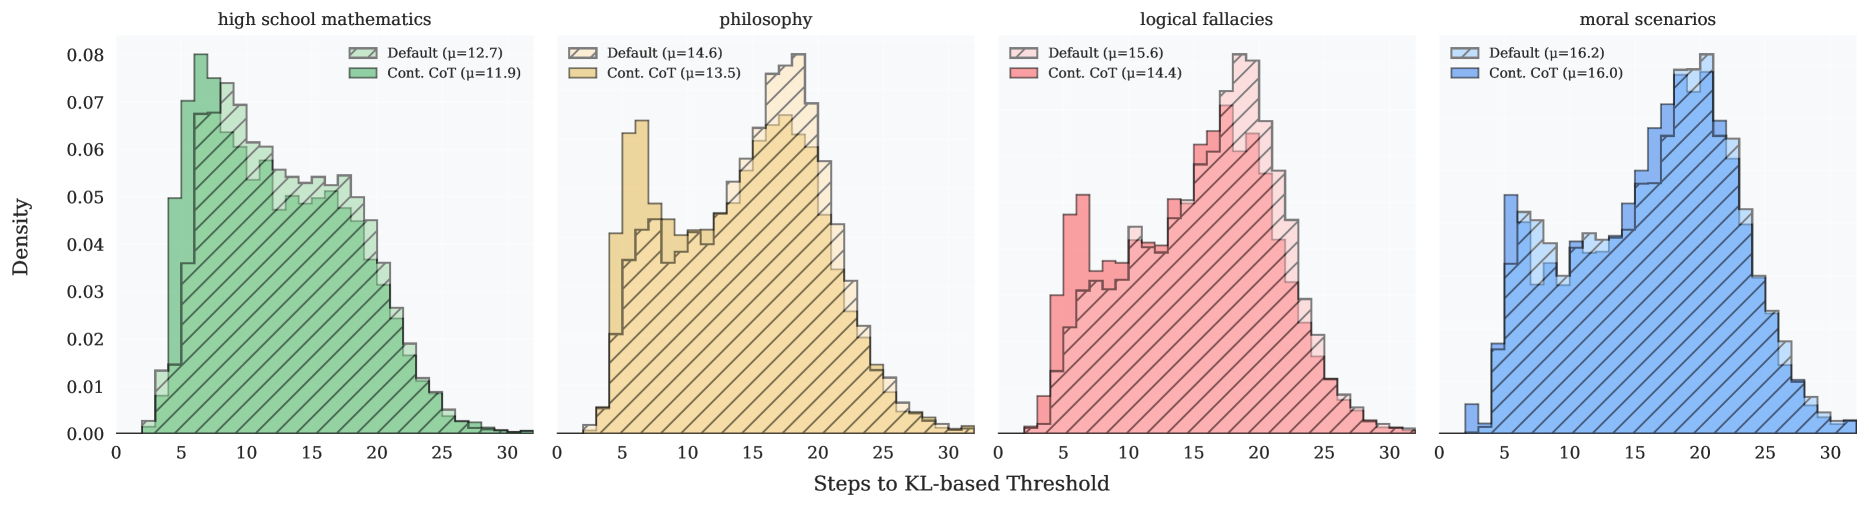
The image presents four histograms, each representing the density distribution of "Steps to KL-based Threshold" for different scenarios: high school mathematics, philosophy, logical fallacies, and moral scenarios. Each histogram displays two distributions, labeled "Default" and "Cont. CoT" (Chain of Thought), with associated mean (μ) values.
### Components/Axes
* **X-axis:** "Steps to KL-based Threshold" - ranging from 0 to 30, with increments of 5.
* **Y-axis:** "Density" - ranging from 0.00 to 0.08, with increments of 0.01.
* **Histograms:** Four separate histograms, one for each scenario.
* **Legend:** Each histogram has a legend in the top-left corner indicating the two distributions:
* "Default" (Green for high school mathematics, Yellow for philosophy, Red for logical fallacies, Blue for moral scenarios)
* "Cont. CoT" (Light Green for high school mathematics, Light Yellow for philosophy, Light Red for logical fallacies, Light Blue for moral scenarios)
* **Mean Values (μ):** Each legend also displays the mean (μ) value for each distribution.
### Detailed Analysis or Content Details
**1. High School Mathematics (Green)**
* **Default (Green):** The distribution is roughly bell-shaped, peaking around steps 5-10. The density decreases as the number of steps increases. μ = 12.7.
* Approximate Density Values:
* Steps 5: ~0.07
* Steps 10: ~0.06
* Steps 15: ~0.045
* Steps 20: ~0.03
* Steps 25: ~0.015
* **Cont. CoT (Light Green):** The distribution is similar to the "Default" but shifted slightly to the right, peaking around steps 10-15. μ = 11.9.
* Approximate Density Values:
* Steps 5: ~0.05
* Steps 10: ~0.065
* Steps 15: ~0.05
* Steps 20: ~0.03
* Steps 25: ~0.01
**2. Philosophy (Yellow)**
* **Default (Yellow):** The distribution is unimodal, peaking around steps 10-15. The density decreases as the number of steps increases. μ = 14.6.
* Approximate Density Values:
* Steps 5: ~0.04
* Steps 10: ~0.06
* Steps 15: ~0.05
* Steps 20: ~0.03
* Steps 25: ~0.01
* **Cont. CoT (Light Yellow):** The distribution is similar to the "Default" but shifted slightly to the right, peaking around steps 15-20. μ = 13.5.
* Approximate Density Values:
* Steps 5: ~0.03
* Steps 10: ~0.04
* Steps 15: ~0.06
* Steps 20: ~0.04
* Steps 25: ~0.01
**3. Logical Fallacies (Red)**
* **Default (Red):** The distribution is bimodal, with peaks around steps 5 and 15-20. μ = 15.6.
* Approximate Density Values:
* Steps 5: ~0.05
* Steps 10: ~0.03
* Steps 15: ~0.06
* Steps 20: ~0.04
* Steps 25: ~0.01
* **Cont. CoT (Light Red):** The distribution is unimodal, peaking around steps 15-20. μ = 14.4.
* Approximate Density Values:
* Steps 5: ~0.03
* Steps 10: ~0.02
* Steps 15: ~0.06
* Steps 20: ~0.04
* Steps 25: ~0.01
**4. Moral Scenarios (Blue)**
* **Default (Blue):** The distribution is roughly bell-shaped, peaking around steps 15-20. The density decreases as the number of steps increases. μ = 16.2.
* Approximate Density Values:
* Steps 5: ~0.02
* Steps 10: ~0.03
* Steps 15: ~0.07
* Steps 20: ~0.06
* Steps 25: ~0.03
* **Cont. CoT (Light Blue):** The distribution is similar to the "Default" but shifted slightly to the right, peaking around steps 20-25. μ = 16.0.
* Approximate Density Values:
* Steps 5: ~0.01
* Steps 10: ~0.02
* Steps 15: ~0.05
* Steps 20: ~0.07
* Steps 25: ~0.04
### Key Observations
* The "Cont. CoT" distributions generally have lower peaks and are shifted to the right compared to the "Default" distributions, indicating that using Chain of Thought tends to require more steps to reach the KL-based threshold.
* The "Logical Fallacies" scenario exhibits a bimodal distribution for the "Default" setting, suggesting two distinct patterns in the number of steps required.
* The mean values (μ) for "Cont. CoT" are consistently lower than those for "Default" across all scenarios, reinforcing the observation that CoT requires more steps.
### Interpretation
The data suggests that the use of Chain of Thought (CoT) reasoning in these scenarios generally leads to a need for more steps to reach a certain level of confidence (as measured by the KL-based threshold). This could be because CoT involves more complex reasoning processes, requiring more iterations or steps to converge.
The bimodal distribution observed in the "Logical Fallacies" scenario for the "Default" setting is particularly interesting. This could indicate that there are two fundamentally different ways in which the model approaches logical fallacies – one that requires fewer steps and another that requires more. The CoT approach seems to homogenize this, resulting in a unimodal distribution.
The differences in distributions across scenarios highlight the varying complexity of the tasks. Moral scenarios and philosophy, for example, seem to require more steps overall compared to high school mathematics, even without CoT. This aligns with the intuitive understanding that these domains involve more nuanced and abstract reasoning.
The KL-based threshold likely represents a point where the model's confidence in its answer reaches a certain level. The "Steps to KL-based Threshold" metric, therefore, provides insight into the computational effort required to achieve a reliable outcome in each scenario.