## Histograms: KL-based Threshold Steps by Category
### Overview
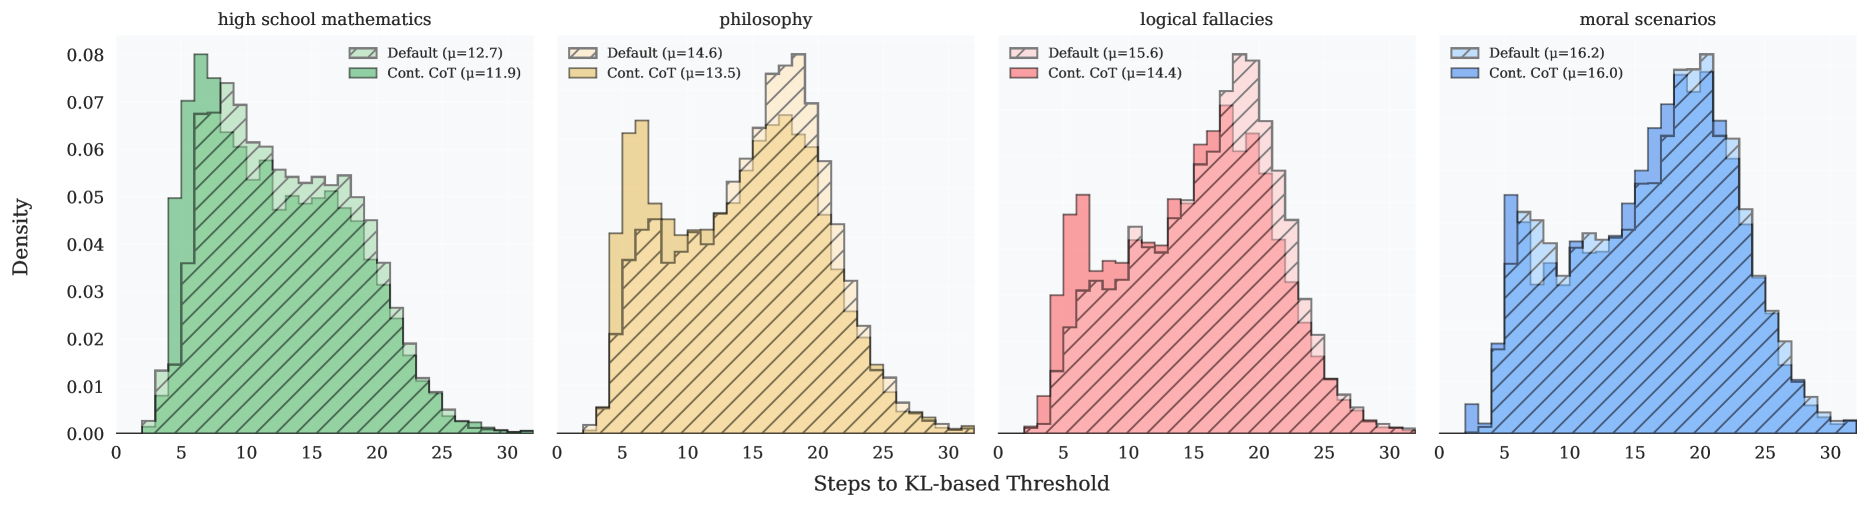
The image displays four side-by-side histograms comparing two data series ("Default" and "Cont. CoT") across four categories: high school mathematics, philosophy, logical fallacies, and moral scenarios. Each histogram shows the distribution of steps required to reach a KL-based threshold, with density on the y-axis and steps on the x-axis. The histograms use distinct colors for each category and differentiate data series via pattern (solid vs. striped).
### Components/Axes
- **X-axis**: "Steps to KL-based Threshold" (range: 0–30, integer increments).
- **Y-axis**: "Density" (range: 0–0.08, increments of 0.01).
- **Legends**: Positioned at the top of each histogram, with:
- **Default**: Light-colored (white/gray) bars with diagonal stripes.
- **Cont. CoT**: Solid-colored bars (green, orange, red, blue for respective categories).
- **Categories**:
1. High school mathematics (green)
2. Philosophy (orange)
3. Logical fallacies (red)
4. Moral scenarios (blue)
### Detailed Analysis
#### High School Mathematics (Green)
- **Default (μ=12.7)**: Peaks at ~12–13 steps, with a broad distribution tapering toward 0 and 30.
- **Cont. CoT (μ=11.9)**: Slightly narrower peak at ~11–12 steps, overlapping with Default but shifted left.
#### Philosophy (Orange)
- **Default (μ=14.6)**: Bimodal distribution with peaks at ~10 and ~20 steps.
- **Cont. CoT (μ=13.5)**: Single peak at ~13–14 steps, narrower than Default.
#### Logical Fallacies (Red)
- **Default (μ=15.6)**: Broad peak centered at ~15–16 steps, with a long tail to the right.
- **Cont. CoT (μ=14.4)**: Tighter peak at ~14–15 steps, reduced tail length.
#### Moral Scenarios (Blue)
- **Default (μ=16.2)**: Sharp peak at ~16–17 steps, with a steep decline on both sides.
- **Cont. CoT (μ=16.0)**: Nearly identical peak to Default but slightly narrower.
### Key Observations
1. **Cont. CoT Consistently Lower μ**: Across all categories, Cont. CoT has lower mean steps (μ) than Default, suggesting improved efficiency.
2. **Narrower Distributions for Cont. CoT**: Cont. CoT histograms are generally tighter, indicating less variability in step counts.
3. **Bimodal Philosophy**: Philosophy’s Default series shows two distinct peaks, unlike other categories.
4. **Moral Scenarios Symmetry**: Both Default and Cont. CoT for moral scenarios exhibit highly symmetric distributions.
### Interpretation
The data suggests that the "Cont. CoT" method reduces the average steps required to reach the KL-based threshold across all categories, with the most pronounced effect in philosophy (Δμ = 1.1). The narrower distributions for Cont. CoT imply more consistent performance, while the bimodal pattern in philosophy’s Default series hints at potential subgroup differences (e.g., easy vs. hard problems). The symmetry in moral scenarios indicates a clear threshold effect, whereas logical fallacies show a longer tail for Default, possibly reflecting complex edge cases. These trends align with the hypothesis that Cont. CoT optimizes step efficiency in reasoning tasks.