# Technical Data Extraction: Performance Comparison Chart
## 1. Component Isolation
* **Header/Legend:** Located in the top-left quadrant. Contains labels for two data series.
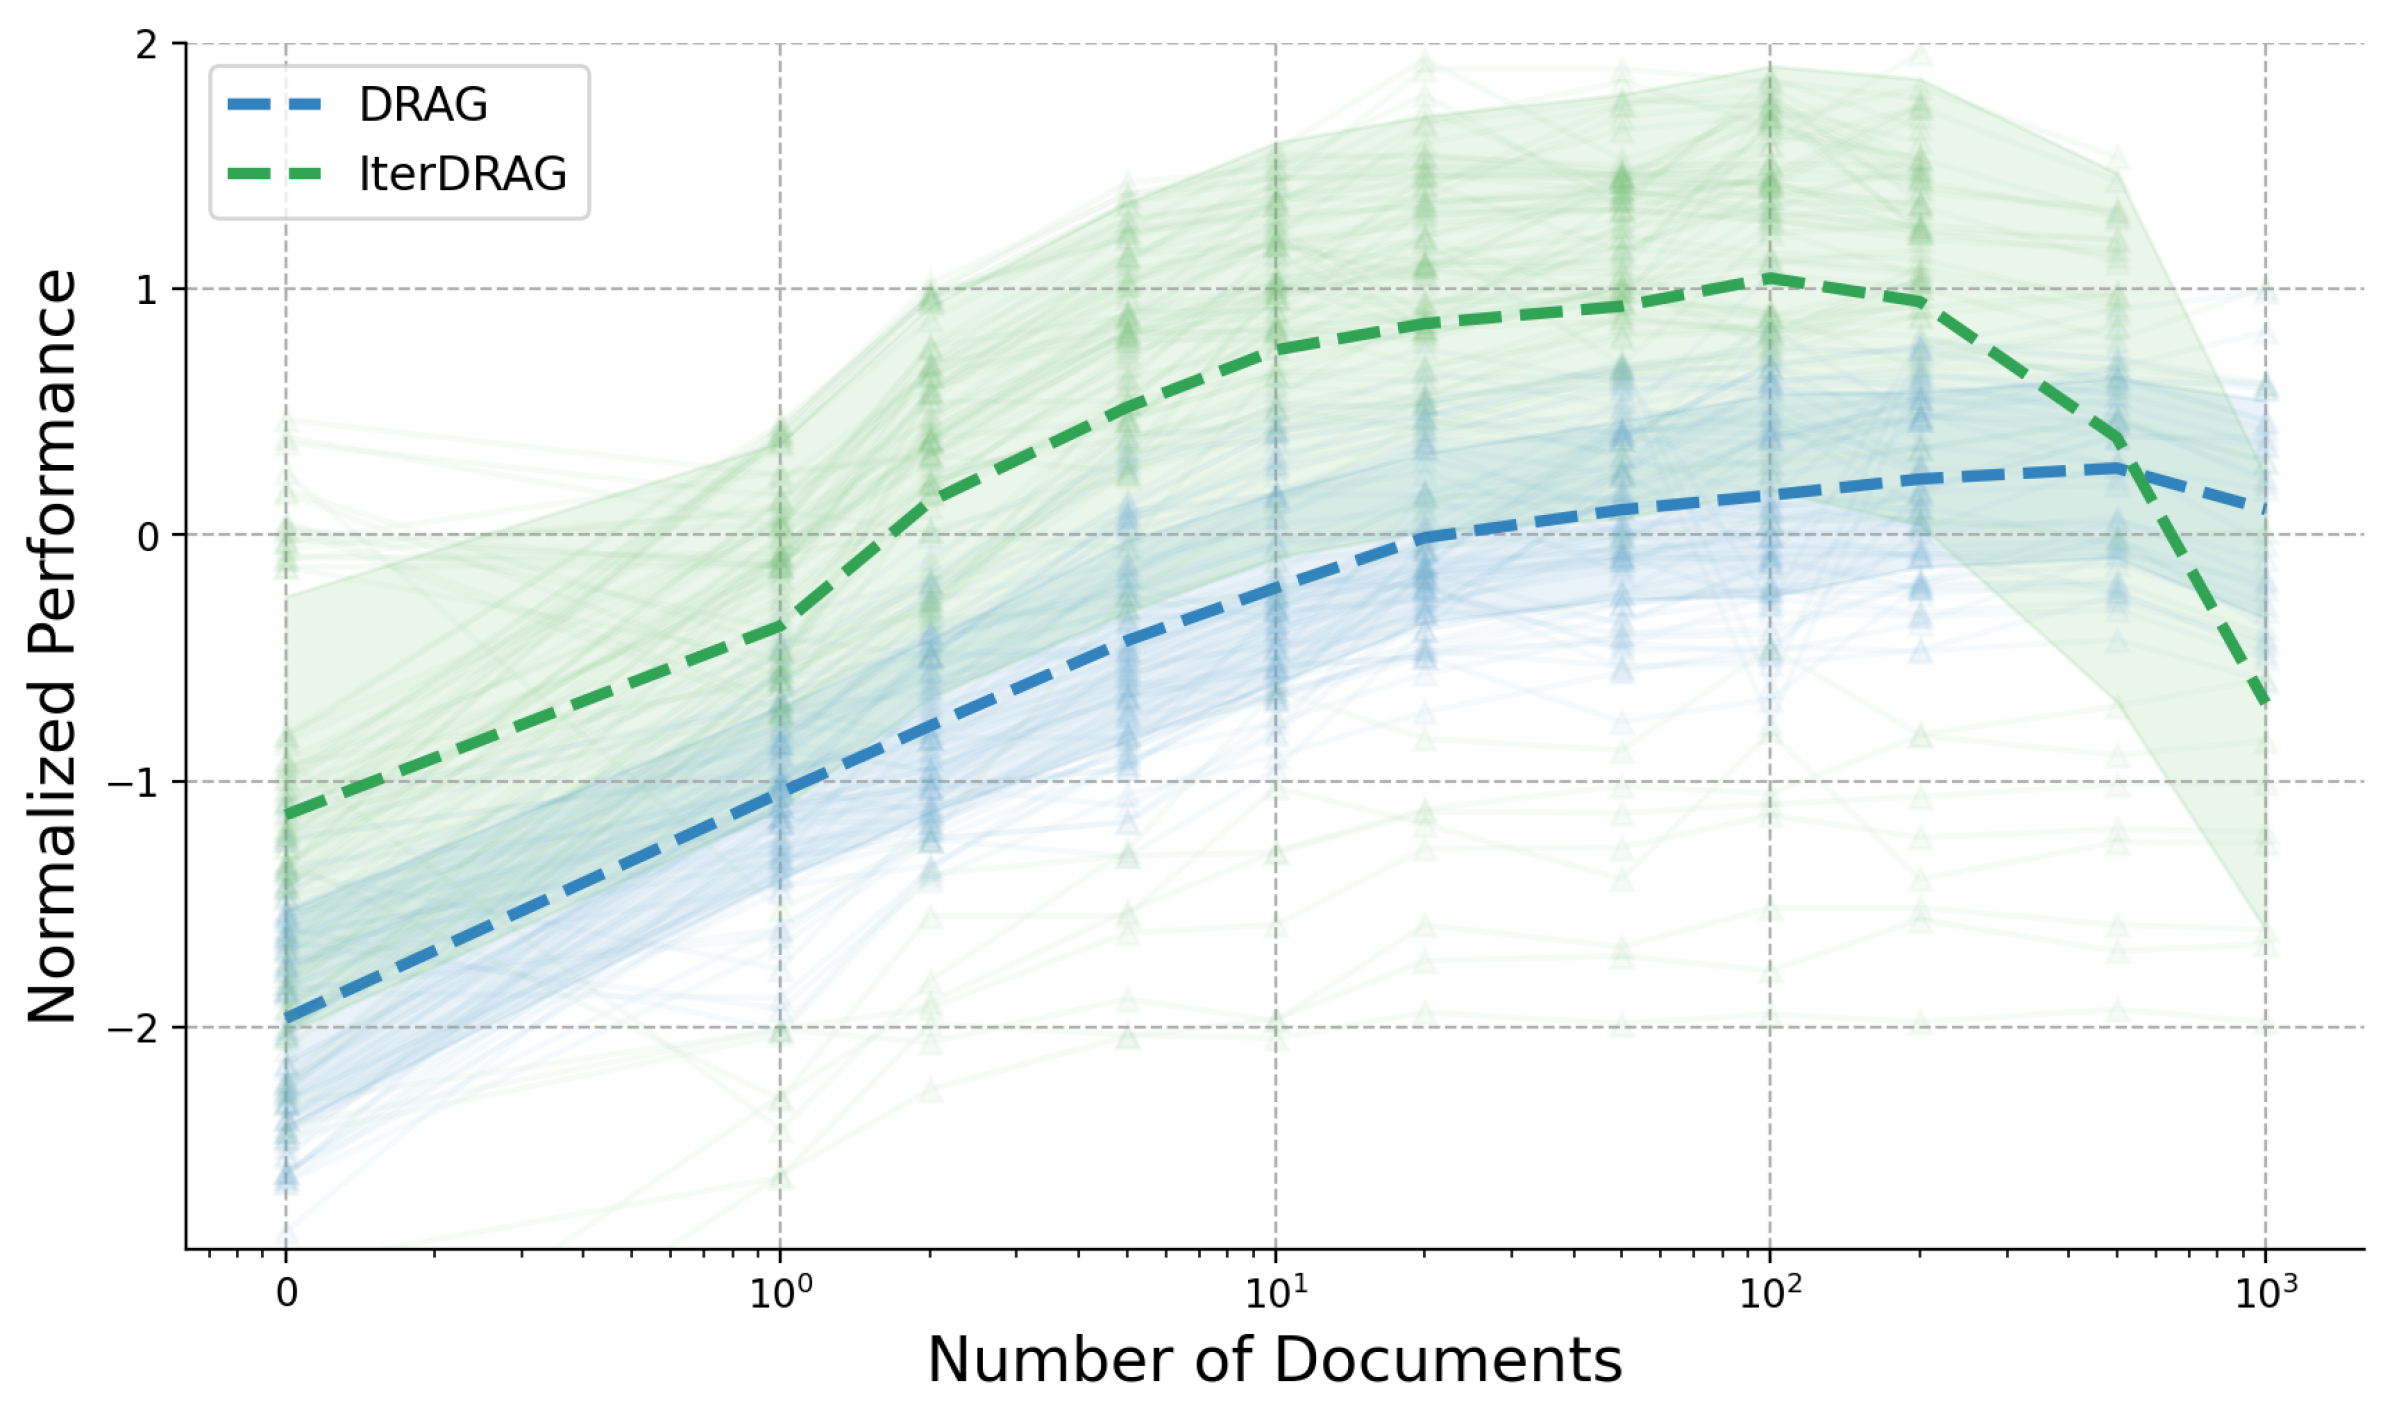
* **Main Chart Area:** A line graph with a logarithmic X-axis and linear Y-axis. It features two primary trend lines (thick dashed) superimposed over a high-density "spaghetti plot" of individual trials (thin translucent lines with triangular markers). Shaded regions represent the variance/confidence intervals for each series.
* **Axes:**
* **Y-Axis (Vertical):** Labeled "Normalized Performance". Range: -3 to 2.
* **X-Axis (Horizontal):** Labeled "Number of Documents". Logarithmic scale. Range: $10^0$ (0 on the plot) to $10^3$.
## 2. Legend and Spatial Grounding
* **Legend Location:** Top-left corner, approximately at [x: 0.1, y: 0.9] in relative coordinates.
* **Series 1: DRAG**
* **Color:** Blue (#377eb8 approx.)
* **Line Style:** Thick dashed line.
* **Associated Data:** Blue shaded region and blue translucent individual trial lines.
* **Series 2: IterDRAG**
* **Color:** Green (#4daf4a approx.)
* **Line Style:** Thick dashed line.
* **Associated Data:** Green shaded region and green translucent individual trial lines.
## 3. Trend Verification and Data Extraction
### Series: IterDRAG (Green)
* **Visual Trend:** The line starts at a higher baseline than DRAG. It shows a strong upward slope from 0 to 100 documents, reaching a peak performance. After 100 documents, it maintains a plateau until approximately 200, followed by a sharp decline toward 1000 documents.
* **Estimated Data Points (Mean):**
* **0 ($10^0$):** ~ -1.1
* **1 ($10^0$):** ~ -0.4
* **2:** ~ 0.1
* **5:** ~ 0.5
* **10 ($10^1$):** ~ 0.75
* **20:** ~ 0.85
* **50:** ~ 0.9
* **100 ($10^2$):** ~ 1.05 (Peak)
* **200:** ~ 0.95
* **500:** ~ 0.4
* **1000 ($10^3$):** ~ -0.7
### Series: DRAG (Blue)
* **Visual Trend:** Starts at a lower baseline (~ -2.0). It exhibits a steady, consistent upward slope throughout the majority of the document range. Unlike IterDRAG, it does not peak early; it continues to rise slowly until approximately 500 documents before showing a slight downward turn at the 1000 mark.
* **Estimated Data Points (Mean):**
* **0 ($10^0$):** ~ -1.95
* **1 ($10^0$):** ~ -1.05
* **2:** ~ -0.8
* **5:** ~ -0.45
* **10 ($10^1$):** ~ -0.25
* **20:** ~ 0.0
* **50:** ~ 0.1
* **100 ($10^2$):** ~ 0.15
* **200:** ~ 0.22
* **500:** ~ 0.28 (Peak)
* **1000 ($10^3$):** ~ 0.1
## 4. Statistical Observations
* **Variance:** Both methods show significant variance, as indicated by the wide shaded regions and the spread of individual trial lines (triangles).
* **Comparative Performance:** **IterDRAG** consistently outperforms **DRAG** in the range of 0 to ~400 documents.
* **Crossover/Convergence:** At the highest document count ($10^3$), the performance of IterDRAG drops significantly, while DRAG remains relatively stable, suggesting DRAG may be more robust at extreme scales, though both show a downward trend at the very end.
* **Peak Performance:** IterDRAG achieves its highest normalized performance (~1.0) at approximately 100 documents. DRAG achieves its highest performance (~0.3) at approximately 500 documents.