# Technical Document Extraction: Line Chart Analysis
## Labels and Axis Information
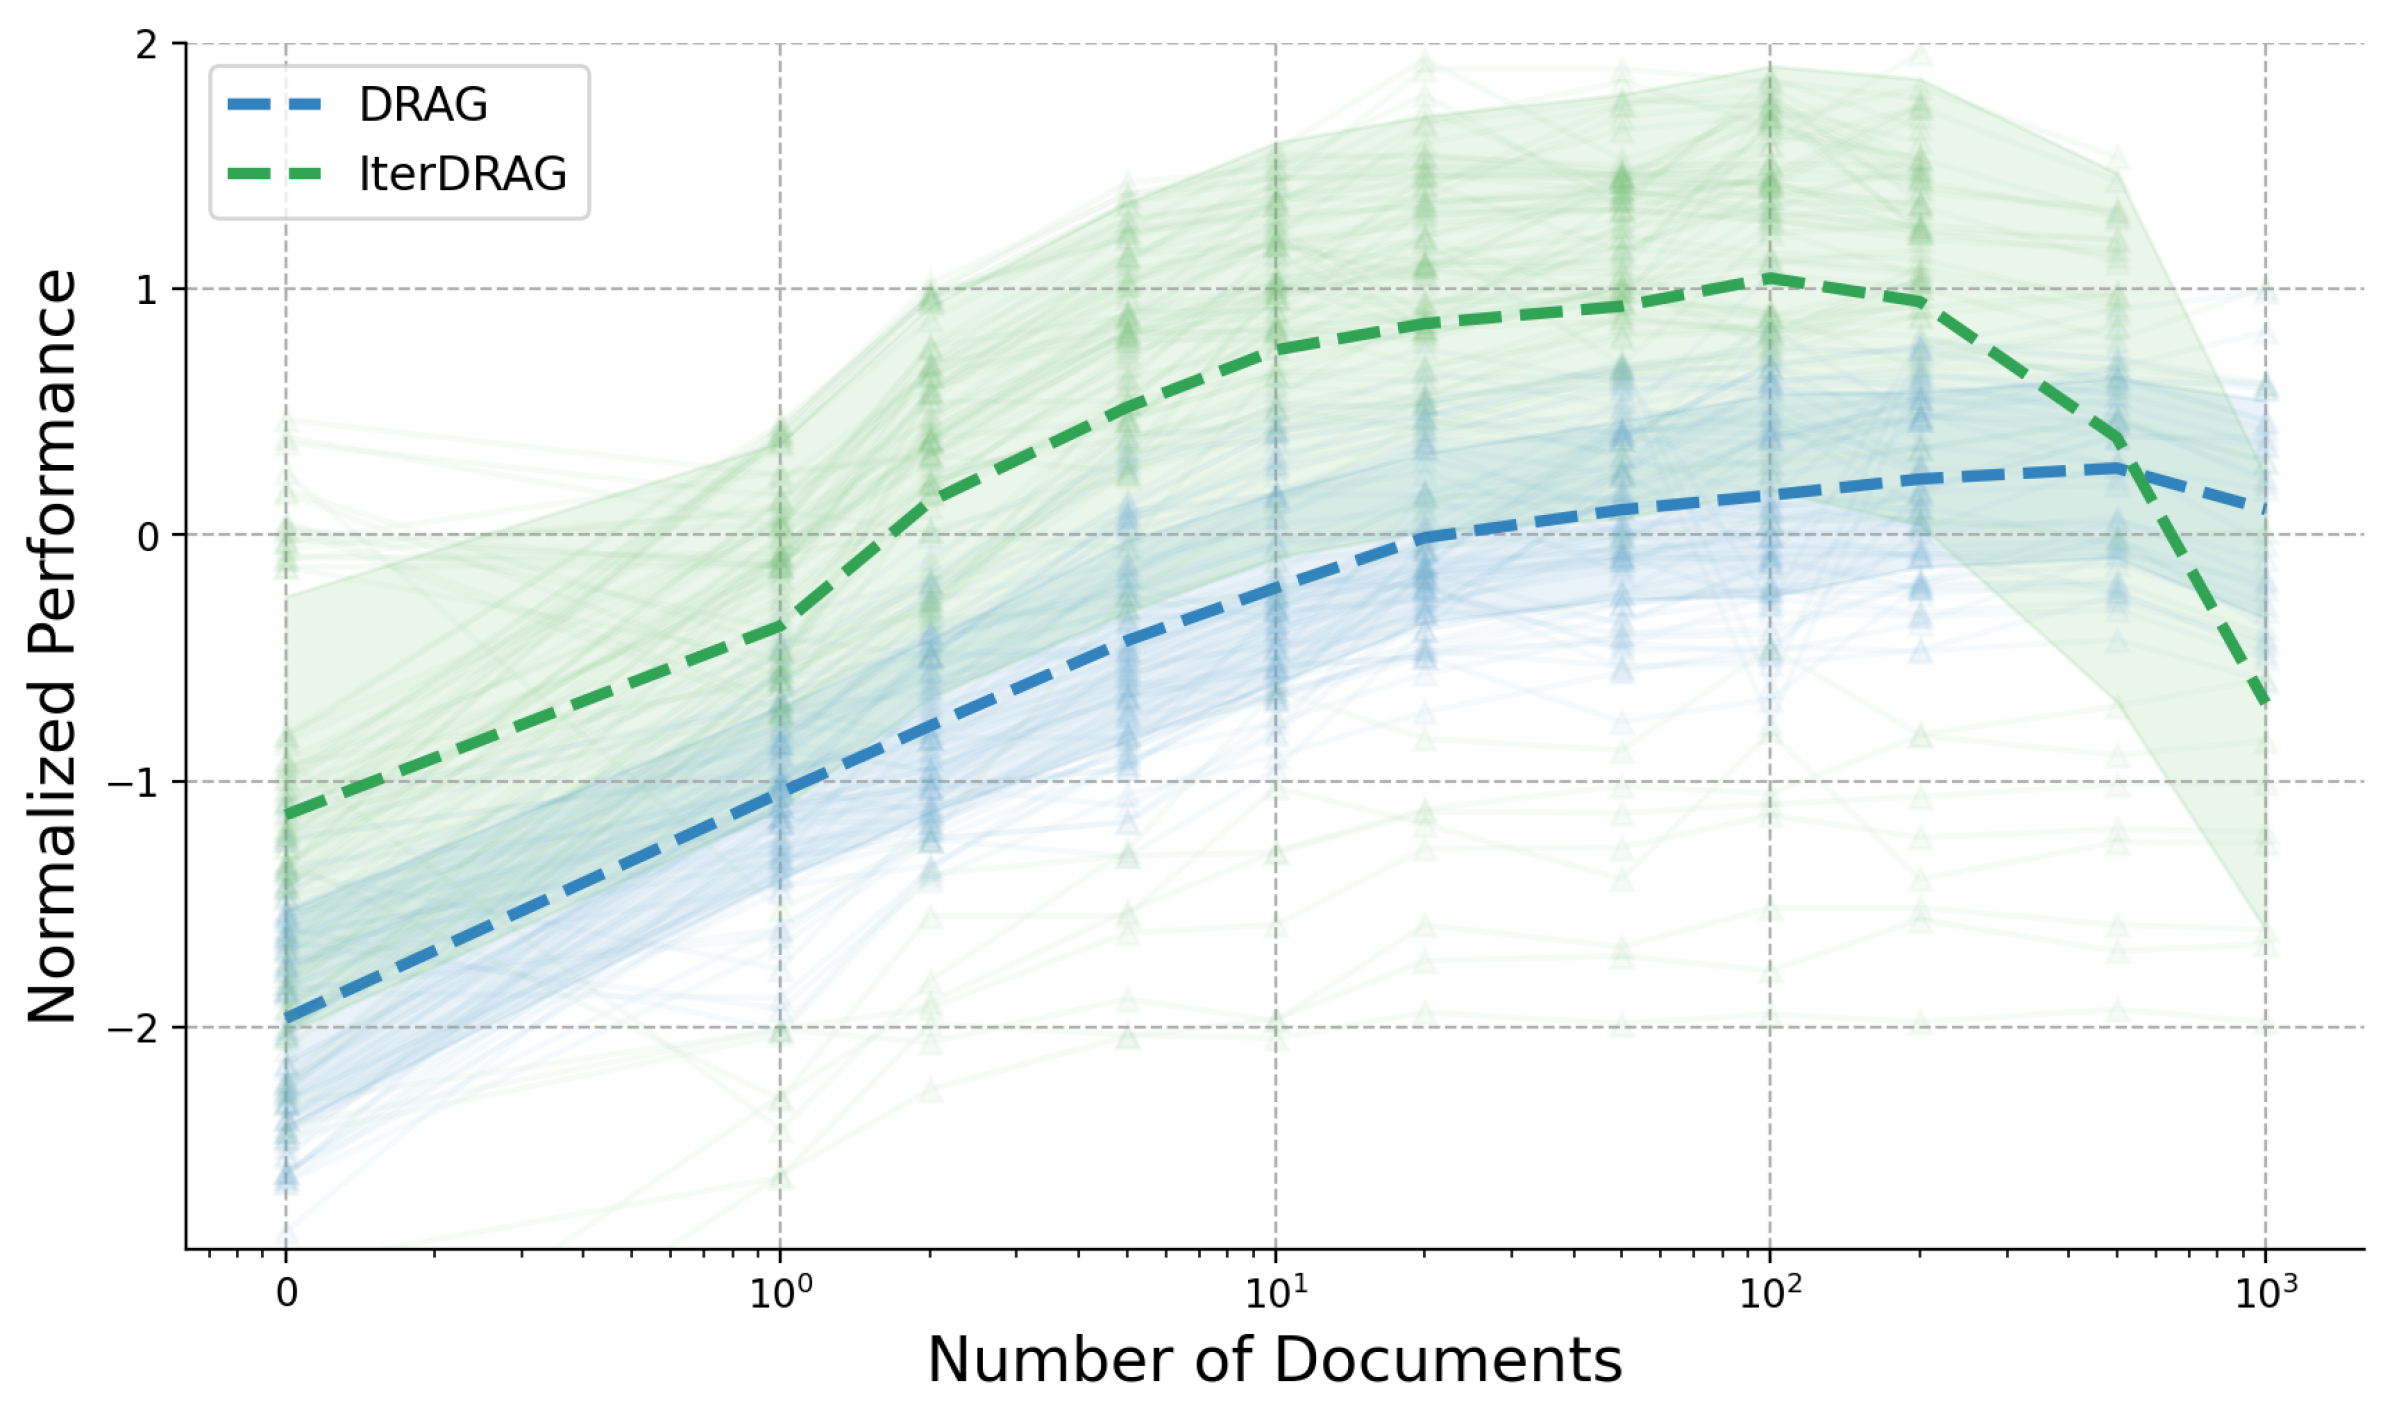
- **X-Axis**: "Number of Documents" (logarithmic scale: 0, 10, 100, 1000)
- **Y-Axis**: "Normalized Performance" (linear scale: -2, -1, 0, 1, 2)
- **Legend**: Located in the top-left corner
- **DRAG**: Blue dashed line
- **IterDRAG**: Green dashed line
## Chart Components
1. **Grid Lines**: Dashed gray lines forming a grid across the plot area.
2. **Shaded Regions**:
- Blue gradient shading around the DRAG line (indicating variability).
- Green gradient shading around the IterDRAG line (indicating variability).
## Data Series Trends
### DRAG (Blue Dashed Line)
- **Trend**:
- Starts at approximately **y = -2** when x = 0.
- Gradually increases, reaching a peak of **y ≈ 0.2** at x = 1000.
- Declines slightly after x = 1000.
- **Key Data Points**:
- x = 10: y ≈ -1.5
- x = 100: y ≈ 0.1
- x = 1000: y ≈ 0.2
### IterDRAG (Green Dashed Line)
- **Trend**:
- Starts at approximately **y = -1** when x = 0.
- Rises sharply, peaking at **y ≈ 1.2** near x = 100.
- Declines sharply after x = 100, reaching **y ≈ -1** at x = 1000.
- **Key Data Points**:
- x = 10: y ≈ -0.5
- x = 100: y ≈ 1.2
- x = 1000: y ≈ -1
## Spatial Grounding
- **Legend Position**: Top-left corner (coordinates: [0, 0.95] relative to the plot area).
- **Line Placement**:
- DRAG (blue) consistently below IterDRAG (green) until x ≈ 100.
- IterDRAG dominates performance until x ≈ 100, after which DRAG surpasses it.
## Variability Analysis
- **Shaded Region Width**:
- IterDRAG's shaded region is wider than DRAG's, indicating higher variability in performance.
- Both shaded regions narrow as x increases, suggesting reduced variability at higher document counts.
## Additional Observations
- **Logarithmic X-Axis**: The x-axis uses a logarithmic scale, causing exponential growth in document counts (e.g., 10 → 100 → 1000).
- **Performance Saturation**: Both lines plateau near y = 0.2 (DRAG) and y = 1.2 (IterDRAG) before declining, suggesting diminishing returns at scale.
## Language Notes
- **Primary Language**: English (all labels, axis titles, and legends are in English).
- **No Non-English Text Detected**.
## Conclusion
The chart compares the normalized performance of two algorithms (DRAG and IterDRAG) across varying document counts. IterDRAG outperforms DRAG at lower document counts but experiences a sharp decline at higher scales, while DRAG maintains steadier performance with gradual improvement.