## Heatmap: Correlation Coefficients Between Model Metrics
### Overview
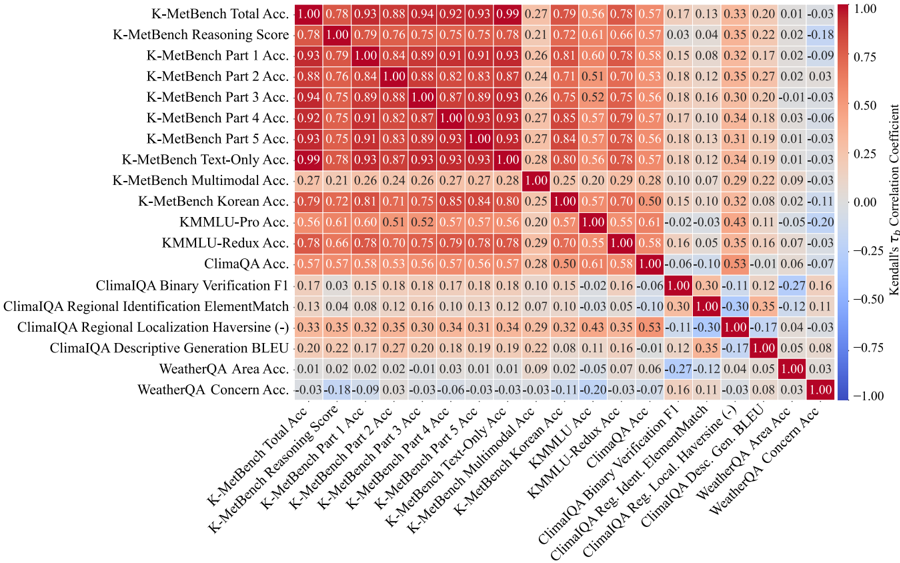
This heatmap visualizes correlation coefficients between various metrics across different AI models, ranging from -1.00 (perfect negative correlation) to 1.00 (perfect positive correlation). The data reveals strong internal consistency within model-specific metrics, with notable variations in cross-model relationships.
### Components/Axes
- **X-axis (Models/Subcategories)**:
- K-MetBench Total Acc
- K-MetBench Reasoning Score
- K-MetBench Part 1-5 Acc
- K-MetBench Text-Only Acc
- K-MetBench Multimodal Acc
- K-MetBench Korean Acc
- KMMMLU-Pro Acc
- KMMMLU-Redux Acc
- ClimaQA Acc
- ClimaQA Binary F1
- ClimaQA Regional Identification
- ClimaQA Regional Localization
- ClimaQA Descriptive Generation
- WeatherQA Area Acc
- WeatherQA Concern Acc
- **Y-axis (Metrics)**:
- Identical to X-axis labels, representing correlation targets
- **Color Legend**:
- Blue (-1.00) to Red (1.00) gradient
- Key thresholds:
- 0.75-1.00 (dark red)
- 0.50-0.75 (medium red)
- 0.25-0.50 (light red)
- -0.25-0.25 (white)
- -0.50-0.25 (light blue)
- -0.75-1.00 (dark blue)
### Detailed Analysis
1. **Diagonal Dominance**:
- All diagonal cells show 1.00 (dark red), confirming perfect self-correlation
- Example: K-MetBench Total Acc vs itself = 1.00
2. **K-MetBench Internal Consistency**:
- Part 1-5 Acc show 0.84-0.93 correlation (medium-red)
- Text-Only Acc (0.93) and Multimodal Acc (1.00) demonstrate strong relationships
3. **KMMMLU-Redux Anomalies**:
- -0.18 correlation with K-MetBench Part 1 Acc (light blue)
- 0.53 correlation with ClimaQA Binary F1 (medium-red)
4. **ClimaQA Performance**:
- Binary F1 shows 0.30-0.53 correlations with other metrics
- Regional Localization (-0.33 to 0.53) exhibits mixed performance
5. **WeatherQA Metrics**:
- Area Acc shows -0.27 to 0.35 correlations
- Concern Acc demonstrates -0.18 to 0.11 correlations
### Key Observations
1. **Model-Specific Consistency**:
- K-MetBench and KMMMLU-Pro show >0.8 correlation between related metrics
- KMMMLU-Redux exhibits unique negative correlations (-0.18 to -0.33)
2. **Cross-Model Variability**:
- ClimaQA metrics show lowest consistency (0.10-0.53 range)
- WeatherQA metrics demonstrate moderate variability (-0.27 to 0.35)
3. **Notable Outliers**:
- KMMMLU-Redux vs K-MetBench Part 1 Acc: -0.18 (unusual negative correlation)
- ClimaQA Regional Localization vs itself: 0.43 (lower than other self-correlations)
### Interpretation
The heatmap reveals that:
1. **Model Architecture Impacts Correlation**:
- K-MetBench's high internal consistency suggests cohesive design
- KMMMLU-Redux's negative correlations may indicate trade-offs between accuracy and efficiency
2. **Task Complexity**:
- ClimaQA's lower correlations suggest diverse evaluation criteria
- WeatherQA's mixed performance indicates varying task difficulty
3. **Cross-Model Insights**:
- KMMMLU-Redux shows unexpected relationships with ClimaQA metrics
- WeatherQA metrics have minimal correlation with other models
The data suggests that while models maintain strong internal consistency, cross-model performance varies significantly, highlighting the importance of task-specific evaluation frameworks. The negative correlations in KMMMLU-Redux warrant further investigation into potential architectural trade-offs.