# Technical Data Extraction: Performance Comparison Across Datasets and Model Configurations
This document provides a comprehensive extraction of data from a 3x2 grid of bar charts comparing model performance (BLEU and Rouge-L scores) across three datasets: **Web NLG**, **CommonGen**, and **Adidas**.
## 1. Document Structure and Global Components
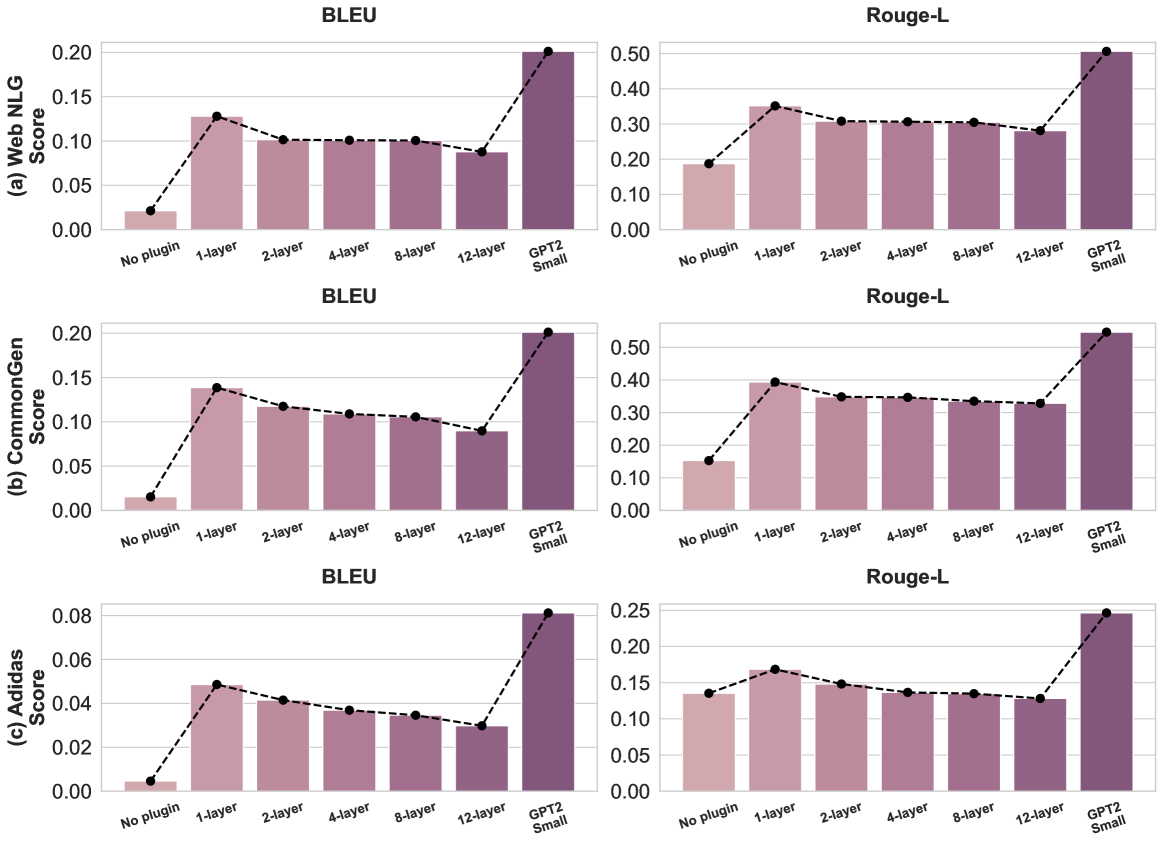
The image is organized into three horizontal rows, each representing a specific dataset, and two vertical columns representing evaluation metrics.
* **Rows (Datasets):**
* (a) Web NLG
* (b) CommonGen
* (c) Adidas
* **Columns (Metrics):**
* BLEU (Left Column)
* Rouge-L (Right Column)
* **X-Axis Categories (Common to all charts):**
1. No plugin
2. 1-layer
3. 2-layer
4. 4-layer
5. 8-layer
6. 12-layer
7. GPT2 Small
* **Visual Encoding:**
* **Bars:** Represent the score for each configuration. The color transitions from light pink (left) to dark purple (right).
* **Dashed Line with Markers:** Connects the top of each bar to visualize the trend across configurations.
* **Y-Axis:** Represents the numerical "Score" for the respective metric.
---
## 2. Detailed Data Extraction by Dataset
### (a) Web NLG Dataset
**Trend Analysis:** Performance spikes significantly when moving from "No plugin" to "1-layer". From "1-layer" to "12-layer", there is a gradual, slight decline in performance. "GPT2 Small" represents the peak performance for both metrics.
| Configuration | BLEU Score (Approx.) | Rouge-L Score (Approx.) |
| :--- | :--- | :--- |
| No plugin | 0.02 | 0.19 |
| 1-layer | 0.13 | 0.35 |
| 2-layer | 0.10 | 0.31 |
| 4-layer | 0.10 | 0.31 |
| 8-layer | 0.10 | 0.30 |
| 12-layer | 0.09 | 0.28 |
| GPT2 Small | 0.20 | 0.51 |
---
### (b) CommonGen Dataset
**Trend Analysis:** Similar to Web NLG, there is a sharp increase at "1-layer". A steady, linear decrease is observed as the number of layers increases from 1 to 12. "GPT2 Small" remains the highest-performing baseline.
| Configuration | BLEU Score (Approx.) | Rouge-L Score (Approx.) |
| :--- | :--- | :--- |
| No plugin | 0.015 | 0.15 |
| 1-layer | 0.14 | 0.39 |
| 2-layer | 0.12 | 0.35 |
| 4-layer | 0.11 | 0.35 |
| 8-layer | 0.105 | 0.34 |
| 12-layer | 0.09 | 0.33 |
| GPT2 Small | 0.20 | 0.55 |
---
### (c) Adidas Dataset
**Trend Analysis:** The scores for this dataset are lower in absolute magnitude compared to the others. The trend follows the same pattern: a peak at "1-layer" followed by a consistent downward slope through "12-layer". "GPT2 Small" shows a significant lead over all plugin configurations.
| Configuration | BLEU Score (Approx.) | Rouge-L Score (Approx.) |
| :--- | :--- | :--- |
| No plugin | 0.005 | 0.135 |
| 1-layer | 0.048 | 0.165 |
| 2-layer | 0.041 | 0.148 |
| 4-layer | 0.037 | 0.138 |
| 8-layer | 0.035 | 0.135 |
| 12-layer | 0.030 | 0.128 |
| GPT2 Small | 0.081 | 0.245 |
---
## 3. Summary of Key Findings
1. **Plugin Impact:** Adding even a single layer ("1-layer") results in a massive performance gain over the "No plugin" baseline across all datasets and metrics.
2. **Layer Scaling:** Increasing the number of layers in the plugin (from 1 to 12) consistently leads to a **decrease** in performance. The 1-layer configuration is the most effective plugin setup shown.
3. **Baseline Comparison:** The "GPT2 Small" model consistently outperforms all plugin-augmented configurations, typically achieving scores roughly double those of the 1-layer plugin in BLEU metrics.
4. **Metric Correlation:** BLEU and Rouge-L scores follow identical trends across all configurations, suggesting that the model improvements (or degradations) are consistent across different linguistic evaluation methods.