## Bar Chart: Sliding Window Compression Ablation
### Overview
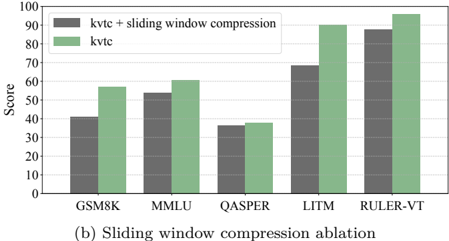
The image displays a grouped bar chart labeled "(b) Sliding window compression ablation." It compares the performance scores of two distinct methods—"kvtc" and "kvtc + sliding window compression"—across five different benchmarks (GSM8K, MMLU, QASPER, LITM, and RULER-VT).
### Components/Axes
* **Y-Axis:** Labeled "Score," representing a numerical performance metric ranging from 0 to 100, with grid lines at intervals of 10.
* **X-Axis:** Categorical, listing the five benchmarks: GSM8K, MMLU, QASPER, LITM, and RULER-VT.
* **Legend:** Positioned in the top-left area of the chart.
* **Dark Grey Bar:** Represents "kvtc + sliding window compression."
* **Light Green Bar:** Represents "kvtc."
### Detailed Analysis
The chart presents grouped bars for each benchmark. In every instance, the "kvtc" (light green) bar is taller than the "kvtc + sliding window compression" (dark grey) bar.
**Estimated Data Points (Score):**
| Benchmark | kvtc (Light Green) | kvtc + sliding window compression (Dark Grey) |
| :--- | :--- | :--- |
| **GSM8K** | ~57 | ~41 |
| **MMLU** | ~61 | ~54 |
| **QASPER** | ~38 | ~36 |
| **LITM** | ~90 | ~68 |
| **RULER-VT** | ~96 | ~88 |
### Key Observations
* **Consistent Degradation:** The addition of "sliding window compression" consistently results in lower scores compared to the baseline "kvtc" method across all five benchmarks.
* **Variable Impact:** The performance penalty incurred by the compression method is not uniform:
* **LITM** exhibits the most significant performance drop (a difference of approximately 22 points).
* **QASPER** exhibits the least significant performance drop (a difference of approximately 2 points).
* **GSM8K** also shows a substantial drop (approximately 16 points).
### Interpretation
The data demonstrates that while "sliding window compression" is likely implemented to optimize resource usage (such as memory or computational efficiency), it introduces a clear performance trade-off.
The varying degrees of degradation suggest that the compression technique is task-dependent. The severe drop in the LITM benchmark implies that the compression method may be discarding information critical to the specific reasoning or retrieval tasks required by LITM. Conversely, the minimal impact on QASPER suggests that the compression method is relatively robust for the specific data structures or query types found in that benchmark. This chart serves as an ablation study, quantifying the "cost" of the compression optimization in terms of model accuracy.