## Line Graph: Complexity vs. Surplus Over Instructions
### Overview
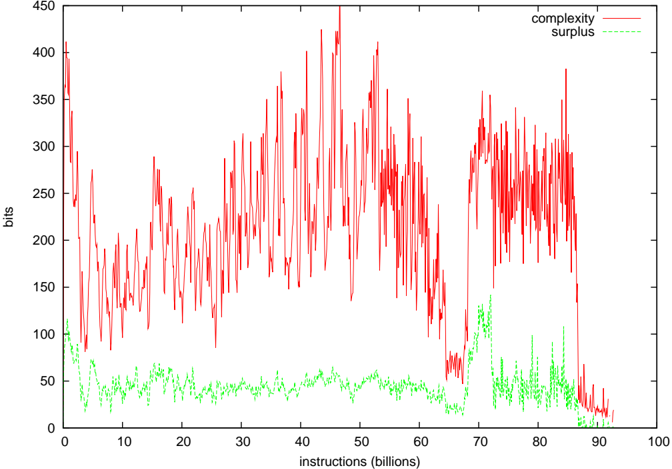
The image is a line graph depicting two data series: "complexity" (red line) and "surplus" (green line), plotted against "instructions (billions)" on the x-axis and "bits" on the y-axis. The red line exhibits high variability with sharp peaks and troughs, while the green line remains relatively stable but shows a gradual increase toward the end of the x-axis range.
### Components/Axes
- **X-axis**: "instructions (billions)" ranging from 0 to 100 (in increments of 10).
- **Y-axis**: "bits" ranging from 0 to 450 (in increments of 50).
- **Legend**: Located in the **top-right corner**, with:
- **Red line**: Labeled "complexity"
- **Green line**: Labeled "surplus"
### Detailed Analysis
1. **Complexity (Red Line)**:
- Starts at approximately **400 bits** at 0 instructions.
- Exhibits **high volatility**, with peaks reaching up to **450 bits** and troughs as low as **100 bits**.
- Shows a **sharp decline** after ~80 billion instructions, dropping to ~50 bits by 100 billion.
- Notable spikes occur around **20, 40, 60, and 80 billion instructions**.
2. **Surplus (Green Line)**:
- Begins at ~100 bits at 0 instructions.
- Remains relatively stable between **50–100 bits** for most of the x-axis range.
- Shows a **gradual increase** after ~70 billion instructions, peaking at ~150 bits near 100 billion.
### Key Observations
- **Inverse Relationship**: As "instructions" increase, "complexity" fluctuates wildly but ultimately decreases sharply, while "surplus" remains stable before rising.
- **Threshold Effect**: The sharp drop in complexity after 80 billion instructions suggests a potential system limitation or optimization point.
- **Stability vs. Volatility**: "Surplus" demonstrates consistent behavior, whereas "complexity" is highly erratic, indicating differing underlying dynamics.
### Interpretation
The data suggests a system where **complexity decreases as surplus increases**, possibly reflecting resource allocation, optimization, or a trade-off between computational load and available capacity. The abrupt decline in complexity after 80 billion instructions could indicate a **critical threshold** where the system becomes more efficient or constrained. The stability of "surplus" implies a controlled or buffered resource, while the volatility of "complexity" may reflect external factors or algorithmic inefficiencies.
**Note**: All values are approximate due to the graph's granularity and lack of explicit numerical markers.