## Density Plot: Accuracy Distribution Across Multiple Reasoning Rounds for Various Models
### Overview
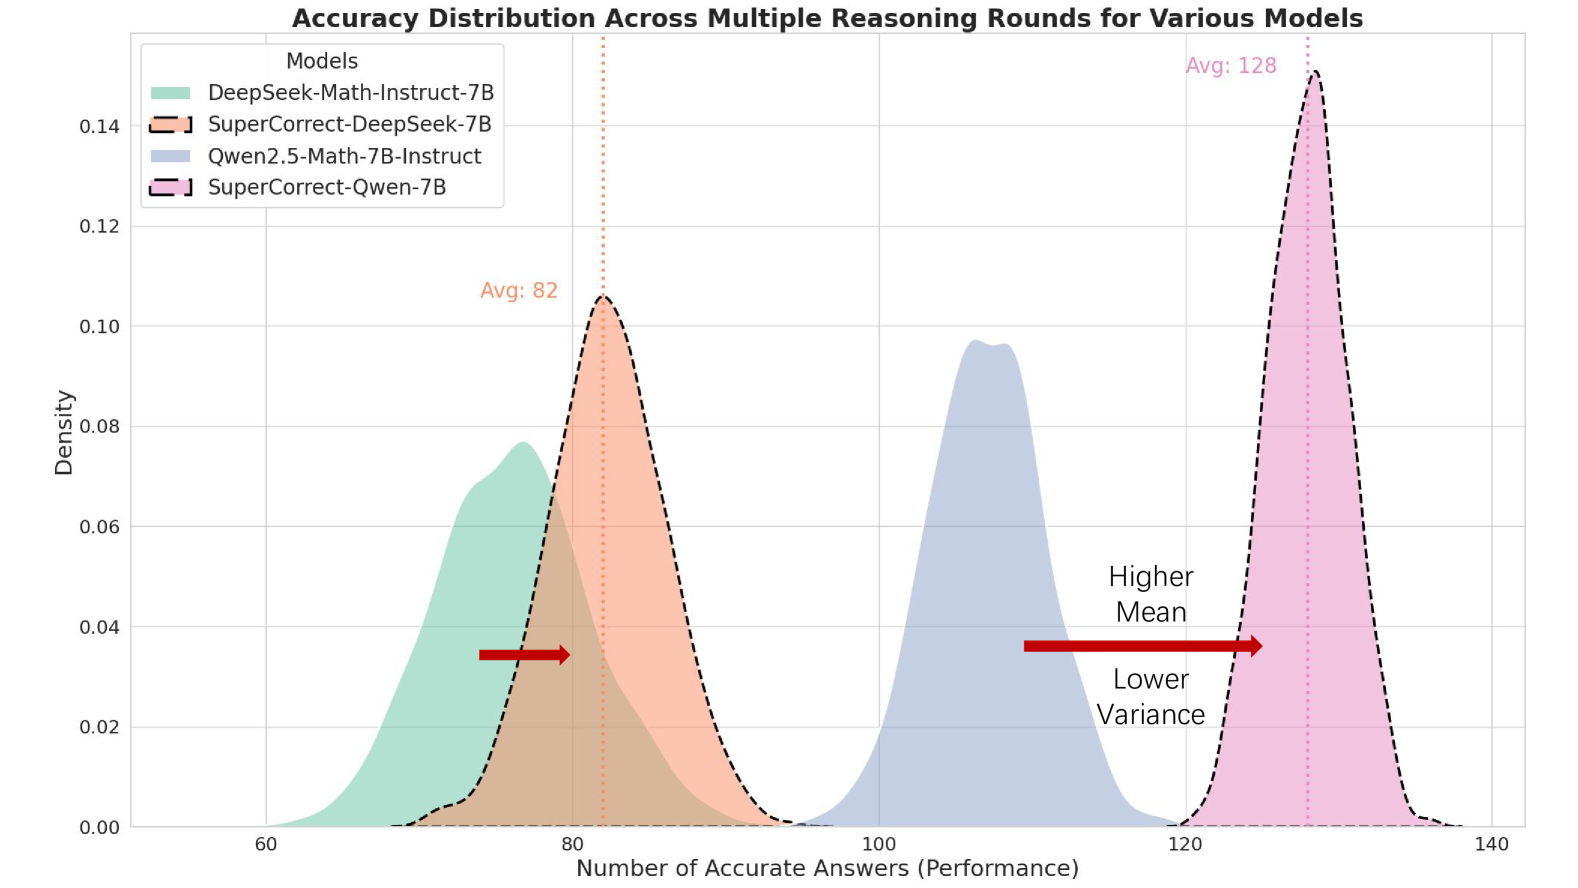
The image is a density plot comparing the accuracy distributions of four different language models across multiple reasoning rounds. The plot shows the density (probability) of achieving a certain number of accurate answers (performance) for each model. The x-axis represents the number of accurate answers, and the y-axis represents the density. The plot also includes annotations indicating the average performance of two of the models and a general trend of higher mean and lower variance.
### Components/Axes
* **Title:** Accuracy Distribution Across Multiple Reasoning Rounds for Various Models
* **X-axis:** Number of Accurate Answers (Performance), ranging from 60 to 140 in increments of 20.
* **Y-axis:** Density, ranging from 0.00 to 0.14 in increments of 0.02.
* **Legend (top-left):**
* DeepSeek-Math-Instruct-7B (light green)
* SuperCorrect-DeepSeek-7B (light orange)
* Qwen2.5-Math-7B-Instruct (light blue)
* SuperCorrect-Qwen-7B (light pink)
* **Annotations:**
* "Avg: 82" (light orange) near the SuperCorrect-DeepSeek-7B distribution.
* "Avg: 128" (light pink) near the SuperCorrect-Qwen-7B distribution.
* "Higher Mean, Lower Variance" (black text) with a red arrow pointing from the Qwen2.5-Math-7B-Instruct distribution to the SuperCorrect-Qwen-7B distribution.
### Detailed Analysis
* **DeepSeek-Math-Instruct-7B (light green):** The distribution is centered around 75 accurate answers. It has a wider spread, indicating higher variance.
* The density peaks around 0.07.
* The distribution ranges approximately from 60 to 85.
* **SuperCorrect-DeepSeek-7B (light orange):** The distribution is centered around 82 accurate answers. It has a narrower spread than DeepSeek-Math-Instruct-7B, indicating lower variance.
* The density peaks around 0.11.
* The distribution ranges approximately from 70 to 90.
* **Qwen2.5-Math-7B-Instruct (light blue):** The distribution is centered around 110 accurate answers. It has a moderate spread, indicating moderate variance.
* The density peaks around 0.10.
* The distribution ranges approximately from 95 to 125.
* **SuperCorrect-Qwen-7B (light pink):** The distribution is centered around 128 accurate answers. It has the narrowest spread, indicating the lowest variance.
* The density peaks around 0.14.
* The distribution ranges approximately from 115 to 140.
### Key Observations
* The SuperCorrect-Qwen-7B model has the highest average accuracy (128) and the lowest variance.
* The DeepSeek-Math-Instruct-7B model has the lowest average accuracy and the highest variance.
* The SuperCorrect-DeepSeek-7B model has an average accuracy of 82.
* There is a clear trend of increasing mean accuracy and decreasing variance from DeepSeek-Math-Instruct-7B to SuperCorrect-Qwen-7B.
### Interpretation
The density plot visualizes the performance of four different language models on a reasoning task. The distributions show how consistently each model achieves a certain level of accuracy. The SuperCorrect-Qwen-7B model stands out as having both the highest average accuracy and the lowest variance, suggesting it is the most reliable and accurate model among the four. The DeepSeek-Math-Instruct-7B model, on the other hand, shows the lowest average accuracy and highest variance, indicating less consistent and lower performance. The annotation "Higher Mean, Lower Variance" highlights the general trend observed as models are improved or refined, leading to more accurate and consistent results. The plot demonstrates the impact of model architecture and training on reasoning performance.