\n
## Density Plot: Accuracy Distribution Across Multiple Reasoning Rounds for Various Models
### Overview
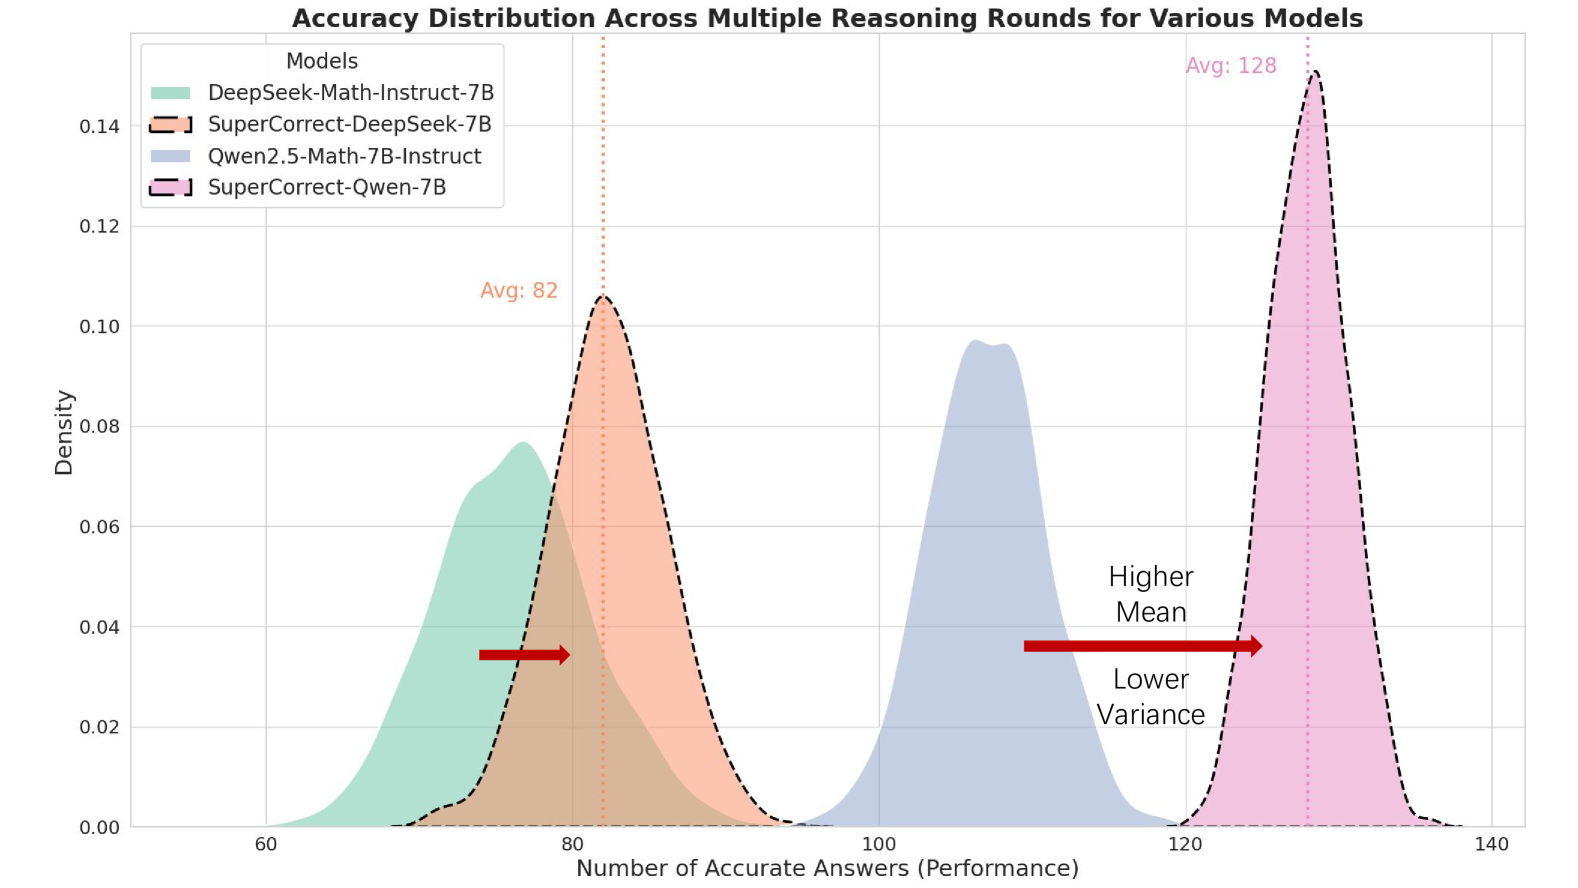
This image presents a density plot comparing the accuracy distributions of four different language models across multiple reasoning rounds. The x-axis represents the "Number of Accurate Answers (Performance)", and the y-axis represents the "Density". The plot visualizes how frequently different performance levels occur for each model.
### Components/Axes
* **Title:** "Accuracy Distribution Across Multiple Reasoning Rounds for Various Models" (Top-center)
* **X-axis Label:** "Number of Accurate Answers (Performance)" (Bottom-center) - Scale ranges from approximately 50 to 140.
* **Y-axis Label:** "Density" (Left-center) - Scale ranges from 0.00 to 0.14.
* **Legend:** Located in the top-left corner, listing the models and their corresponding colors:
* DeepSeek-Math-Instruct-7B (Light Green)
* SuperCorrect-DeepSeek-7B (Orange, dashed line)
* Qwen2.5-Math-7B-Instruct (Light Blue)
* SuperCorrect-Qwen-7B (Purple, dotted line)
* **Annotations:** Two red arrows with text labels:
* "Higher Mean" pointing from the SuperCorrect-DeepSeek-7B peak to the SuperCorrect-Qwen-7B peak.
* "Lower Variance" pointing from the SuperCorrect-DeepSeek-7B distribution to the SuperCorrect-Qwen-7B distribution.
* **Average Markers:** Two "Avg:" labels with numerical values:
* Avg: 82 (Above the SuperCorrect-DeepSeek-7B peak)
* Avg: 128 (Above the SuperCorrect-Qwen-7B peak)
### Detailed Analysis
* **DeepSeek-Math-Instruct-7B (Light Green):** The density curve is centered around approximately 75-85. It starts at a density of roughly 0.01 at 60, rises to a peak density of approximately 0.10 at 80, and then declines to around 0.02 at 110.
* **SuperCorrect-DeepSeek-7B (Orange, dashed line):** The density curve is centered around approximately 80-85. It starts at a density of roughly 0.01 at 65, rises to a peak density of approximately 0.11 at 82, and then declines to around 0.02 at 115.
* **Qwen2.5-Math-7B-Instruct (Light Blue):** The density curve is centered around approximately 95-105. It starts at a density of roughly 0.01 at 70, rises to a peak density of approximately 0.10 at 100, and then declines to around 0.02 at 130.
* **SuperCorrect-Qwen-7B (Purple, dotted line):** The density curve is centered around approximately 125-135. It starts at a density of roughly 0.01 at 90, rises to a peak density of approximately 0.14 at 128, and then declines to around 0.02 at 140.
### Key Observations
* The SuperCorrect-Qwen-7B model consistently exhibits the highest accuracy, with its distribution shifted significantly to the right compared to the other models.
* The SuperCorrect-DeepSeek-7B model shows a slightly higher average accuracy than the base DeepSeek-Math-Instruct-7B model.
* The Qwen2.5-Math-7B-Instruct model has a higher average accuracy than the DeepSeek-Math-Instruct-7B model.
* The SuperCorrect-Qwen-7B model has a lower variance in its accuracy distribution, indicating more consistent performance.
* The average accuracy values (82 and 128) align with the peak densities observed in the respective distributions.
### Interpretation
The data suggests that applying the "SuperCorrect" method significantly improves the accuracy of both the DeepSeek and Qwen models. The Qwen model, when combined with SuperCorrect, outperforms all other models by a substantial margin, achieving both a higher mean accuracy and a lower variance. This indicates that SuperCorrect is particularly effective when applied to the Qwen architecture. The density plots effectively visualize the distribution of performance, allowing for a clear comparison of the models' capabilities and consistency. The annotations highlight the key differences in mean and variance, emphasizing the benefits of the SuperCorrect approach, especially for the Qwen model. The difference in the distributions suggests that the SuperCorrect method not only increases the average performance but also reduces the likelihood of significantly inaccurate results.