## Density Plot: Accuracy Distribution Across Multiple Reasoning Rounds for Various Models
### Overview
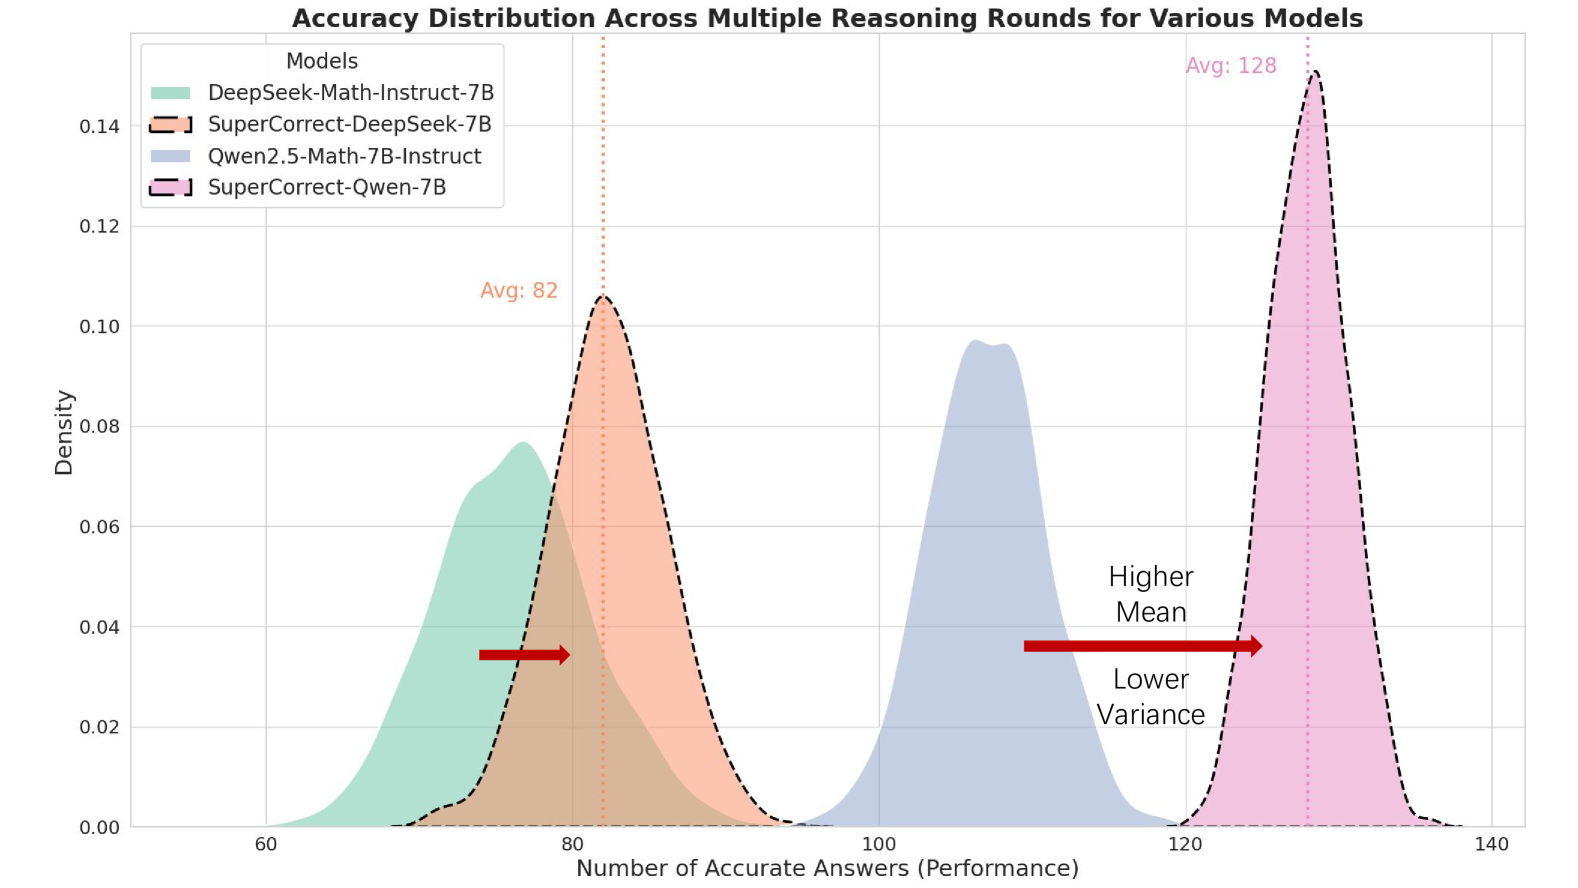
The image is a density plot comparing the performance distributions of four different AI models. The chart visualizes how the number of accurate answers (a performance metric) is distributed across multiple reasoning rounds for each model. The primary comparison is between base models and their "SuperCorrect" enhanced versions.
### Components/Axes
* **Title:** "Accuracy Distribution Across Multiple Reasoning Rounds for Various Models"
* **X-Axis:** Labeled "Number of Accurate Answers (Performance)". The scale runs from approximately 55 to 140, with major tick marks at 60, 80, 100, 120, and 140.
* **Y-Axis:** Labeled "Density". The scale runs from 0.00 to 0.14, with major tick marks at intervals of 0.02.
* **Legend:** Located in the top-left corner. It lists four models with corresponding colors and line styles:
* `DeepSeek-Math-Instruct-7B`: Represented by a solid teal/green fill.
* `SuperCorrect-DeepSeek-7B`: Represented by an orange fill with a black dashed outline.
* `Qwen2.5-Math-7B-Instruct`: Represented by a solid blue fill.
* `SuperCorrect-Qwen-7B`: Represented by a pink fill with a black dashed outline.
* **Annotations:**
* A vertical orange dotted line at approximately x=82, labeled "Avg: 82" in orange text, indicating the mean for the `SuperCorrect-DeepSeek-7B` distribution.
* A vertical pink dotted line at approximately x=128, labeled "Avg: 128" in pink text, indicating the mean for the `SuperCorrect-Qwen-7B` distribution.
* Two red arrows with text:
* One arrow points from the teal (`DeepSeek-Math-Instruct-7B`) distribution to the orange (`SuperCorrect-DeepSeek-7B`) distribution.
* A second, longer arrow points from the blue (`Qwen2.5-Math-7B-Instruct`) distribution to the pink (`SuperCorrect-Qwen-7B`) distribution. The text "Higher Mean" is above this arrow, and "Lower Variance" is below it.
### Detailed Analysis
The plot displays four distinct probability density distributions:
1. **DeepSeek-Math-Instruct-7B (Teal, Solid Fill):**
* **Trend/Shape:** A unimodal, slightly right-skewed distribution.
* **Range:** Spans from approximately 60 to 95 on the x-axis.
* **Peak:** The highest density (mode) occurs at approximately 75-78 accurate answers.
* **Spread:** Shows moderate variance.
2. **SuperCorrect-DeepSeek-7B (Orange, Dashed Outline):**
* **Trend/Shape:** A unimodal, symmetric, and narrower distribution compared to its base model.
* **Range:** Spans from approximately 70 to 100.
* **Peak:** The highest density occurs at approximately 82 accurate answers, which is also the annotated mean ("Avg: 82").
* **Spread:** Shows lower variance than the base DeepSeek model. The red arrow indicates a shift to the right (higher mean) and a narrowing (lower variance).
3. **Qwen2.5-Math-7B-Instruct (Blue, Solid Fill):**
* **Trend/Shape:** A unimodal, symmetric distribution.
* **Range:** Spans from approximately 95 to 120.
* **Peak:** The highest density occurs at approximately 105-110 accurate answers.
* **Spread:** Shows moderate variance, similar to the base DeepSeek model but centered at a higher performance level.
4. **SuperCorrect-Qwen-7B (Pink, Dashed Outline):**
* **Trend/Shape:** A very tall, narrow, and symmetric unimodal distribution.
* **Range:** Spans from approximately 120 to 135.
* **Peak:** The highest density occurs at approximately 128 accurate answers, which is also the annotated mean ("Avg: 128").
* **Spread:** Shows the lowest variance of all four distributions. The red arrow explicitly labels this shift as "Higher Mean" and "Lower Variance".
### Key Observations
1. **Clear Performance Hierarchy:** There is a distinct separation in performance clusters. The two base models (teal, blue) occupy lower performance ranges than their "SuperCorrect" counterparts (orange, pink).
2. **Effect of "SuperCorrect":** For both the DeepSeek and Qwen model families, the "SuperCorrect" version demonstrates two consistent improvements over the base model:
* **Higher Mean Accuracy:** The entire distribution shifts significantly to the right along the x-axis.
* **Lower Variance:** The distributions become much narrower and taller, indicating more consistent and reliable performance across reasoning rounds.
3. **Relative Improvement:** The performance jump from `Qwen2.5-Math-7B-Instruct` to `SuperCorrect-Qwen-7B` appears larger (a shift of ~18-23 points in the mean) than the jump from `DeepSeek-Math-Instruct-7B` to `SuperCorrect-DeepSeek-7B` (a shift of ~4-7 points in the mean).
4. **Outliers:** No significant outliers are visible in the density estimates; the distributions are smooth and well-defined.
### Interpretation
This chart provides strong visual evidence for the efficacy of the "SuperCorrect" method applied to two different base language models (DeepSeek and Qwen) on a mathematical reasoning task.
* **What the data suggests:** The "SuperCorrect" technique does not merely improve average accuracy; it fundamentally changes the performance profile of the models. It makes them both **more accurate** (higher mean) and **more reliable** (lower variance). A model with lower variance is preferable for deployment because its performance is more predictable.
* **Relationship between elements:** The paired distributions (base vs. corrected) for each model family are directly linked by the red arrows, which serve as a visual hypothesis: applying SuperCorrect causes a shift towards higher mean and lower variance. The data strongly supports this hypothesis for both model families shown.
* **Notable implications:** The fact that the corrected Qwen model achieves a much higher mean and lower variance than the corrected DeepSeek model suggests that the starting base model's capabilities or the interaction with the correction method may influence the final outcome. The "SuperCorrect-Qwen-7B" model, with its peak at 128 and very narrow spread, represents a highly optimized and consistent performer for this specific evaluation.