# Technical Document Extraction: Accuracy Distribution Chart
## Chart Title
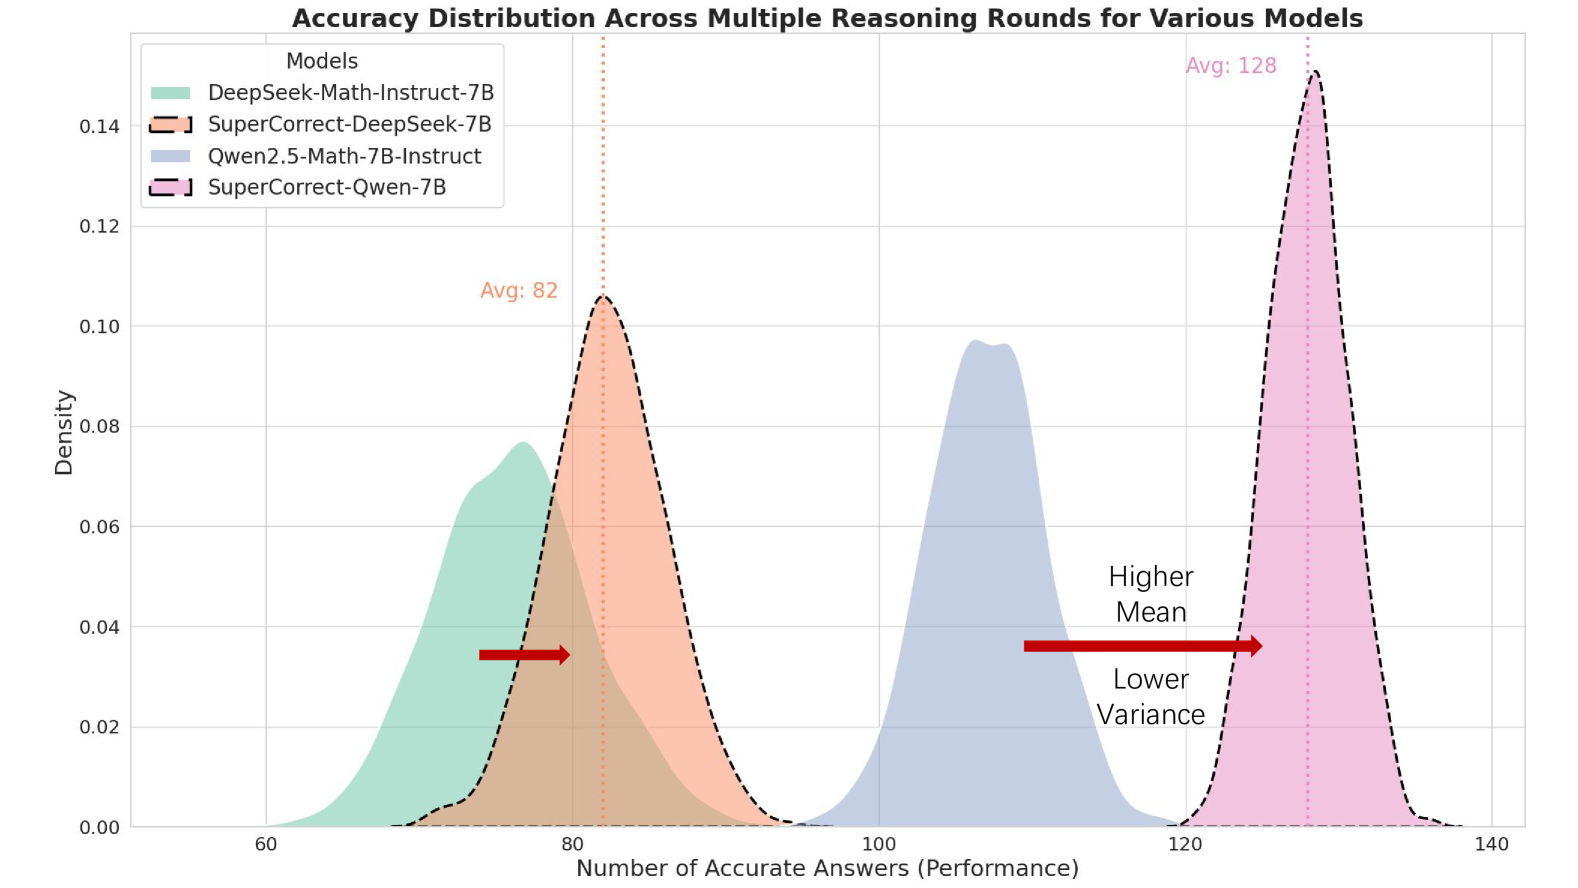
**Accuracy Distribution Across Multiple Reasoning Rounds for Various Models**
---
### Axis Labels
- **X-Axis**: `Number of Accurate Answers (Performance)`
- Range: 60 to 140 (inferred from axis limits)
- **Y-Axis**: `Density`
- Range: 0.00 to 0.14
---
### Legend
- **Position**: Top-left corner
- **Entries**:
1. `DeepSeek-Math-Instruct-7B` (Green)
2. `SuperCorrect-DeepSeek-7B` (Orange)
3. `Qwen2.5-Math-7B-Instruct` (Blue)
4. `SuperCorrect-Qwen-7B` (Pink)
---
### Data Series & Trends
1. **DeepSeek-Math-Instruct-7B (Green)**
- **Trend**: Leftmost distribution, peaks near 80.
- **Key Data**:
- Average Accuracy: `82` (annotated with orange dotted line).
2. **SuperCorrect-DeepSeek-7B (Orange)**
- **Trend**: Overlaps with green distribution, peaks near 80.
- **Key Data**:
- Average Accuracy: `82` (annotated with orange dotted line).
3. **Qwen2.5-Math-7B-Instruct (Blue)**
- **Trend**: Centered distribution, peaks near 100.
- **Key Data**:
- Average Accuracy: `100` (annotated with pink dotted line).
- **Annotation**: "Higher Mean" (red arrow pointing to blue line).
4. **SuperCorrect-Qwen-7B (Pink)**
- **Trend**: Rightmost distribution, peaks near 128.
- **Key Data**:
- Average Accuracy: `128` (annotated with pink dotted line).
- **Annotation**: "Lower Variance" (red arrow pointing to pink line).
---
### Annotations
- **Red Arrows**:
- "Higher Mean" (points to blue line).
- "Lower Variance" (points to pink line).
---
### Spatial Grounding
- **Legend Coordinates**: Top-left (exact pixel values not provided).
- **Axis Markers**:
- X-axis ticks at 60, 80, 100, 120, 140.
- Y-axis ticks at 0.00, 0.02, 0.04, 0.06, 0.08, 0.10, 0.12, 0.14.
---
### Component Isolation
1. **Header**: Chart title centered at the top.
2. **Main Chart**:
- Four overlapping density curves with shaded areas.
- Dotted lines marking average accuracies.
3. **Footer**: No explicit footer text.
---
### Verification
- **Color Consistency**:
- All legend labels match line colors (e.g., green = DeepSeek-Math-Instruct-7B).
- **Trend Logic**:
- Blue line (Qwen2.5-Math-7B-Instruct) has the highest mean (100) and overlaps with pink line (SuperCorrect-Qwen-7B) at higher accuracies.
- Pink line (SuperCorrect-Qwen-7B) has the highest mean (128) and narrowest spread (lowest variance).
---
### Missing Information
- No explicit data table or numerical values beyond averages.
- No textual description of variance calculations.
---
### Final Notes
- The chart compares model performance via density distributions, emphasizing mean accuracy and variance.
- SuperCorrect-Qwen-7B (pink) outperforms others in mean accuracy and consistency.
- Qwen2.5-Math-7B-Instruct (blue) shows moderate performance with higher variance than SuperCorrect-Qwen-7B.