\n
## Chart: Reliability Diagrams for Qwen-2.5-7B Models
### Overview
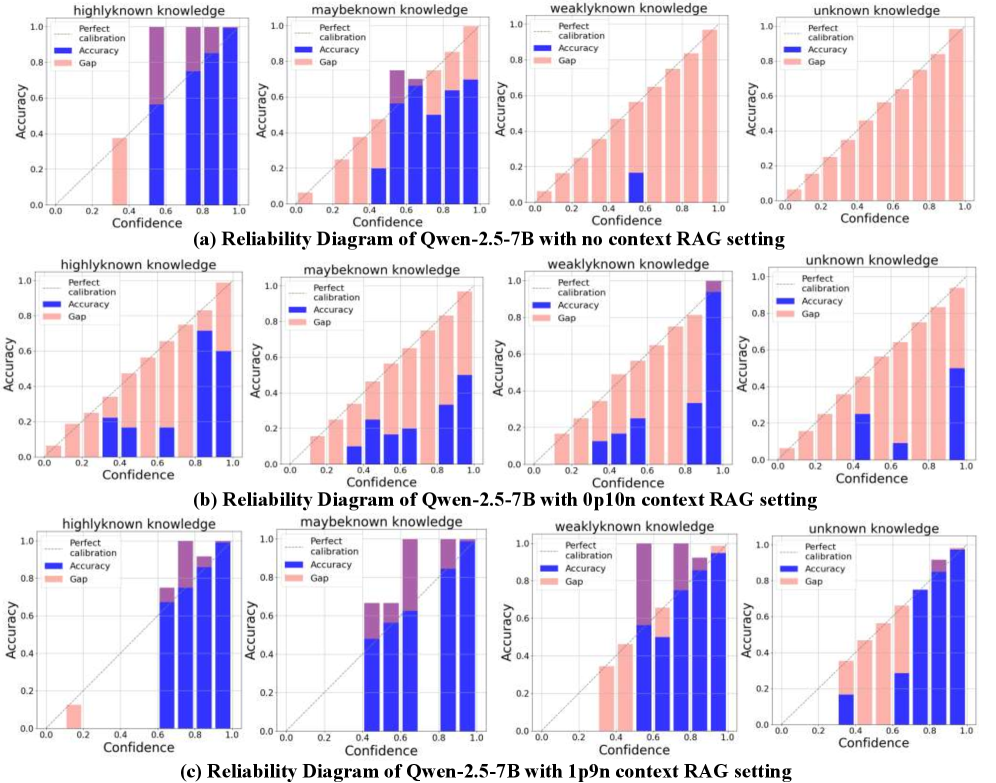
This image presents a series of reliability diagrams comparing the performance of the Qwen-2.5-7B language model under different conditions. There are three rows, each representing a different setting: (a) no context RAG setting, (b) option context RAG setting, and (c) 10 context RAG setting. Each row contains four sub-charts, one for each knowledge type: highlyknown knowledge, maybeknown knowledge, weaklyknown knowledge, and unknown knowledge. The diagrams plot accuracy against confidence, with shaded regions indicating the gap between perfect calibration and actual accuracy.
### Components/Axes
* **X-axis:** Confidence (ranging from 0.0 to 1.0)
* **Y-axis:** Accuracy (ranging from 0.0 to 1.0)
* **Legend:**
* Perfect calibration (dark blue)
* Accuracy (light blue)
* Gap (red)
* **Sub-chart Titles:** Each sub-chart is labeled with the knowledge type and the RAG setting.
* **Overall Title:** Each row has a title indicating the RAG setting used.
### Detailed Analysis or Content Details
**Row (a): No context RAG setting**
* **Highlyknown knowledge:** The accuracy line (light blue) is consistently below the perfect calibration line (dark blue), with a significant gap (red) across all confidence levels. The accuracy is approximately 0.6-0.8, while perfect calibration is at 1.0.
* **Maybeknown knowledge:** Similar to highlyknown knowledge, the accuracy line is below the perfect calibration line, but the gap is smaller. Accuracy ranges from approximately 0.5 to 0.8.
* **Weaklyknown knowledge:** The accuracy line is significantly below the perfect calibration line, with a large gap. Accuracy is approximately 0.3-0.6.
* **Unknown knowledge:** The accuracy line is very low, close to 0.2, and far below the perfect calibration line, resulting in a substantial gap.
**Row (b): Option context RAG setting**
* **Highlyknown knowledge:** The accuracy line is closer to the perfect calibration line than in (a), but still slightly below. Accuracy ranges from approximately 0.7 to 0.9.
* **Maybeknown knowledge:** The accuracy line is closer to the perfect calibration line than in (a), with a smaller gap. Accuracy ranges from approximately 0.6 to 0.8.
* **Weaklyknown knowledge:** The accuracy line is closer to the perfect calibration line than in (a), but still below. Accuracy ranges from approximately 0.4 to 0.7.
* **Unknown knowledge:** The accuracy line is higher than in (a), but still below the perfect calibration line. Accuracy is approximately 0.3-0.5.
**Row (c): 10 context RAG setting**
* **Highlyknown knowledge:** The accuracy line is very close to the perfect calibration line, with a minimal gap. Accuracy ranges from approximately 0.8 to 1.0.
* **Maybeknown knowledge:** The accuracy line is close to the perfect calibration line, with a small gap. Accuracy ranges from approximately 0.7 to 0.9.
* **Weaklyknown knowledge:** The accuracy line is closer to the perfect calibration line than in (a) and (b), but still below. Accuracy ranges from approximately 0.5 to 0.8.
* **Unknown knowledge:** The accuracy line is significantly higher than in (a) and (b), approaching the perfect calibration line. Accuracy is approximately 0.4-0.7.
### Key Observations
* The model's performance improves significantly with the addition of context (moving from no context to 10 context RAG setting).
* The gap between accuracy and perfect calibration is largest for unknown knowledge, indicating the model is least confident and accurate in this scenario.
* Highlyknown knowledge consistently exhibits the highest accuracy across all settings.
* The accuracy generally increases with confidence, but the gap indicates the model is often overconfident in its predictions.
### Interpretation
These reliability diagrams demonstrate the impact of Retrieval-Augmented Generation (RAG) on the calibration of the Qwen-2.5-7B model. The diagrams suggest that providing context (through RAG) improves the model's ability to accurately estimate its own confidence. The model is best calibrated for highlyknown knowledge, meaning it is more likely to accurately reflect its certainty in its predictions for this type of information. Conversely, the model struggles with unknown knowledge, exhibiting a large gap between its confidence and actual accuracy. This suggests that the model is often overconfident when dealing with information it doesn't fully understand. The trend of decreasing gap with increasing context suggests that RAG is a valuable technique for improving the reliability and trustworthiness of language model predictions. The diagrams provide a visual representation of how well the model's predicted probabilities align with its actual performance, which is crucial for applications where accurate uncertainty estimation is important.