## Chart: Receiver Operating Characteristic (ROC) Curve
### Overview
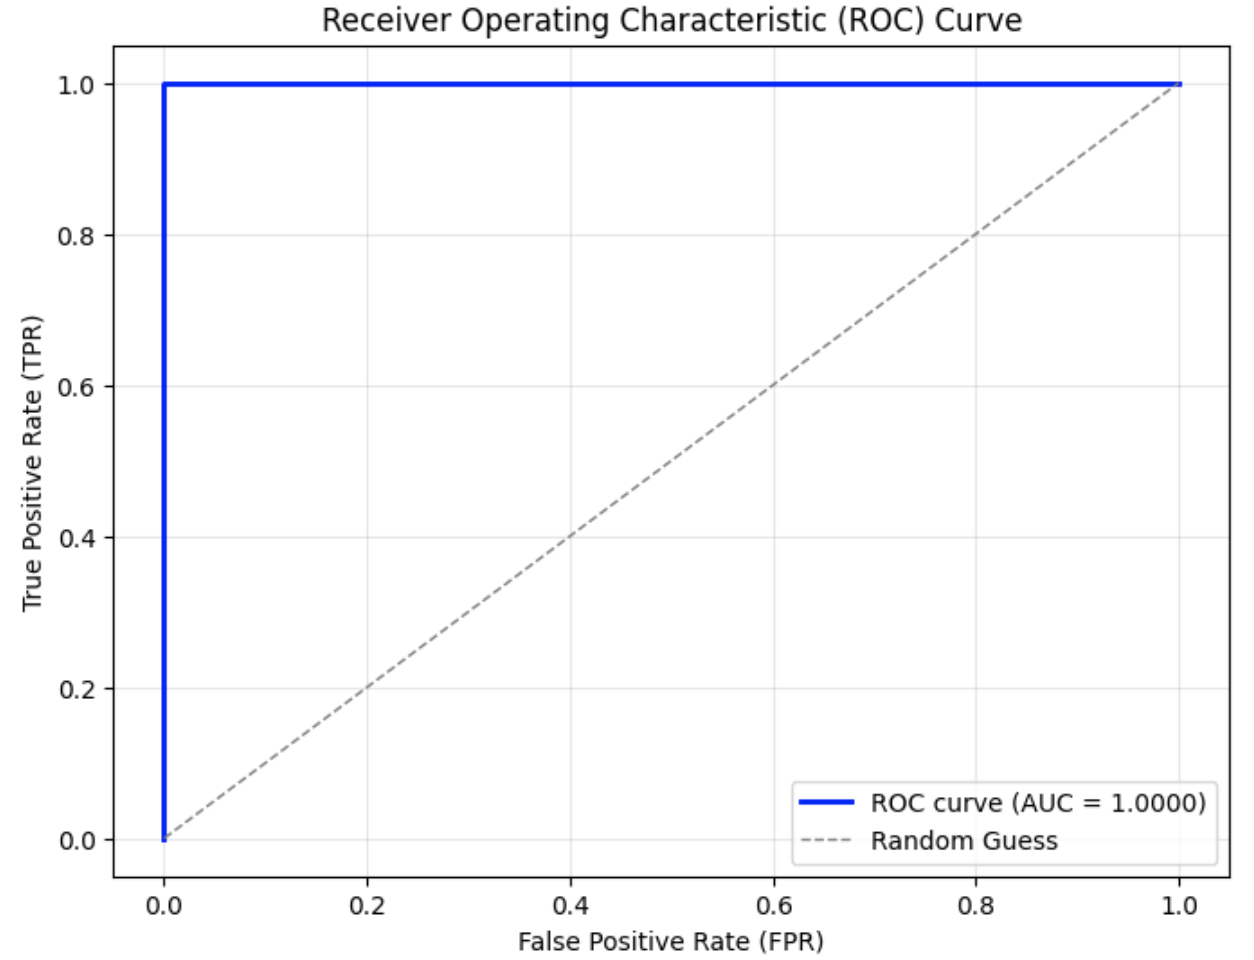
The image is a Receiver Operating Characteristic (ROC) curve, a graphical plot that illustrates the diagnostic ability of a binary classifier system as its discrimination threshold is varied. The plot shows the True Positive Rate (TPR) against the False Positive Rate (FPR). A blue line represents the ROC curve with an Area Under the Curve (AUC) of 1.0000, indicating perfect classification. A dashed gray line represents a random guess.
### Components/Axes
* **Title:** Receiver Operating Characteristic (ROC) Curve
* **X-axis:** False Positive Rate (FPR), with scale from 0.0 to 1.0 in increments of 0.2.
* **Y-axis:** True Positive Rate (TPR), with scale from 0.0 to 1.0 in increments of 0.2.
* **Grid:** Light gray grid lines are present in the background.
* **Legend:** Located in the bottom-right corner:
* Blue line: ROC curve (AUC = 1.0000)
* Dashed gray line: Random Guess
### Detailed Analysis
* **ROC Curve (Blue):** The blue line starts at (0.0, 0.0), rises vertically to (0.0, 1.0), and then extends horizontally to (1.0, 1.0). This indicates a perfect classifier.
* **Random Guess (Dashed Gray):** The dashed gray line starts at (0.0, 0.0) and extends diagonally to (1.0, 1.0). This represents the performance of a classifier that makes random predictions.
### Key Observations
* The ROC curve reaches the top-left corner of the graph, indicating perfect classification.
* The AUC is 1.0000, confirming the perfect classification.
* The random guess line represents the baseline performance of a classifier that makes random predictions.
### Interpretation
The ROC curve demonstrates the performance of a binary classifier. In this case, the classifier achieves perfect separation between the two classes, as indicated by the ROC curve reaching the top-left corner and the AUC being 1.0000. This means that the classifier can perfectly distinguish between positive and negative instances without making any errors. The random guess line serves as a reference point, showing the performance that would be expected from a classifier that makes random predictions. The large difference between the ROC curve and the random guess line highlights the effectiveness of the classifier.