## Chart/Diagram Type: Receiver Operating Characteristic (ROC) Curve
### Overview
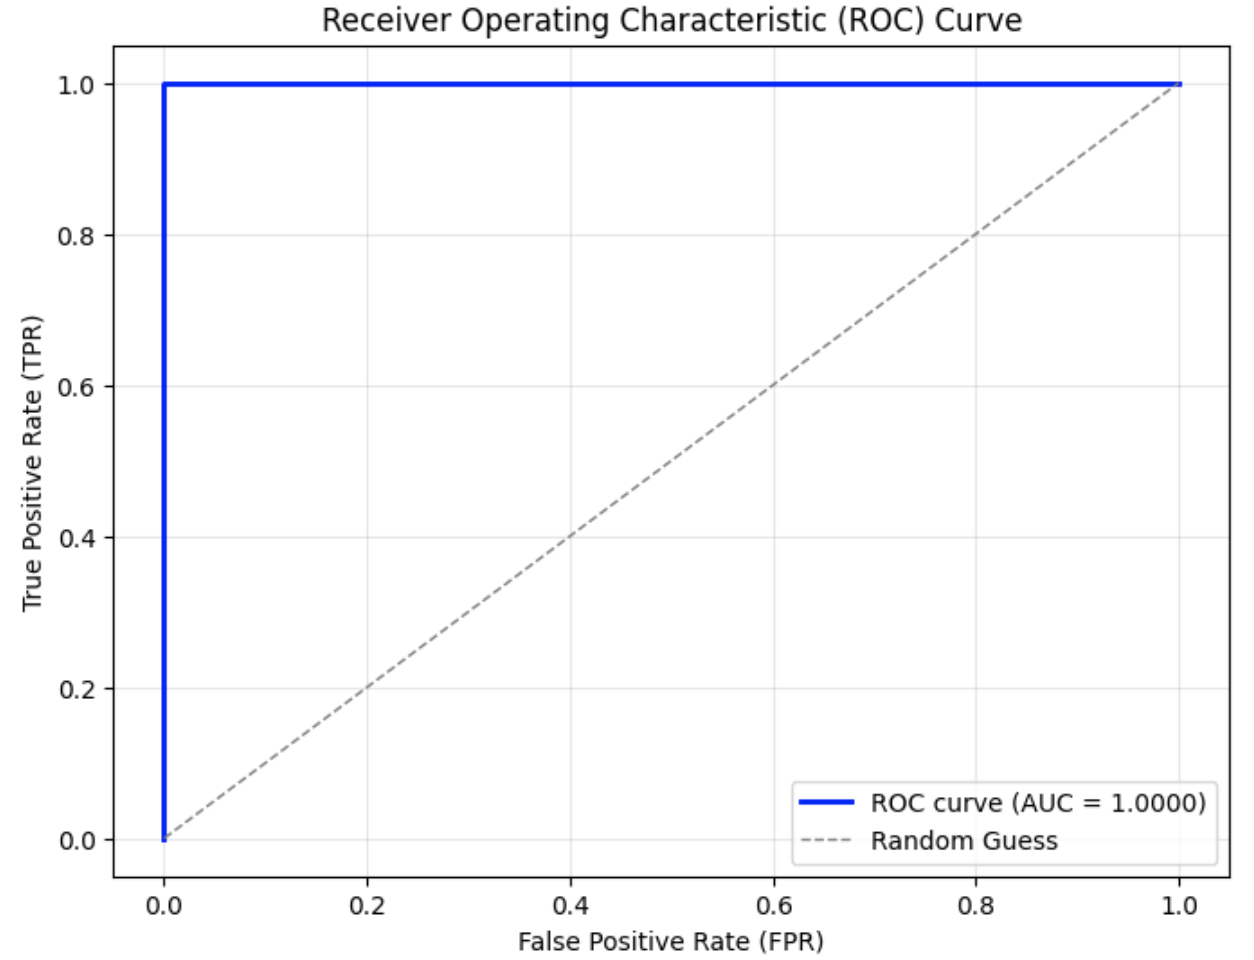
The image depicts a Receiver Operating Characteristic (ROC) Curve, a graphical plot that illustrates the diagnostic ability of a binary classifier system. The curve compares the trade-off between the True Positive Rate (TPR) and the False Positive Rate (FPR) at various threshold settings.
### Components/Axes
- **X-Axis**: Labeled "False Positive Rate (FPR)" with a linear scale from 0.0 to 1.0.
- **Y-Axis**: Labeled "True Positive Rate (TPR)" with a linear scale from 0.0 to 1.0.
- **Legend**: Located in the bottom-right corner, containing two entries:
- **Solid Blue Line**: Labeled "ROC curve (AUC = 1.0000)".
- **Dashed Gray Line**: Labeled "Random Guess".
### Detailed Analysis
- **ROC Curve (Blue Line)**:
- Starts at the origin (0.0, 0.0) and immediately rises vertically to (0.0, 1.0), forming a perfect square.
- Then extends horizontally to (1.0, 1.0).
- The area under the curve (AUC) is explicitly stated as 1.0000, indicating perfect classification.
- **Random Guess Line (Dashed Gray Line)**:
- A straight diagonal line from (0.0, 0.0) to (1.0, 1.0), representing a baseline performance with no discriminative power.
### Key Observations
1. The ROC curve is a perfect square, suggesting the classifier achieves 100% TPR with 0% FPR, which is theoretically ideal but rare in practice.
2. The Random Guess line serves as a reference for random performance, where TPR equals FPR.
3. The AUC value of 1.0000 confirms the classifier’s perfect separation between classes.
### Interpretation
The ROC curve demonstrates a classifier with **perfect performance**, as it achieves maximum TPR without any FPR. This implies the model can distinguish between positive and negative classes with absolute certainty. The Random Guess line highlights the baseline for comparison, emphasizing that the classifier’s performance is far superior to random chance. The AUC of 1.0000 is a theoretical maximum, indicating no overlap between the distributions of positive and negative classes. In real-world scenarios, such a result is uncommon, suggesting either an idealized dataset or a highly optimized model.