## Diagram: IBM HERMES Project Chip Implementation
### Overview
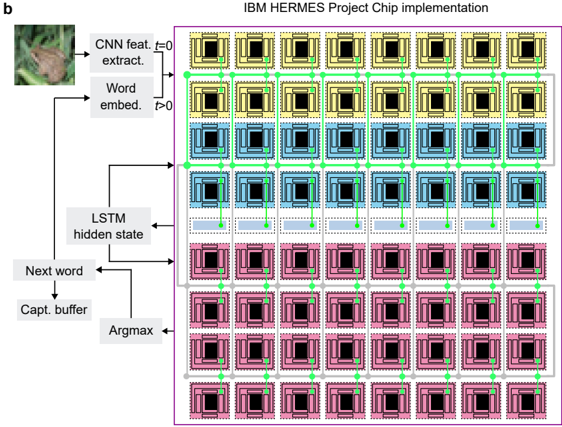
The image presents a diagram illustrating the IBM HERMES Project Chip implementation. It shows a flow of data processing from an image input to a chip architecture. The left side depicts the data processing steps, while the right side shows a grid-like structure representing the chip.
### Components/Axes
* **Title:** IBM HERMES Project Chip implementation
* **Left Side (Data Processing):**
* Image of a frog
* "CNN feat. extract. t=0" - Convolutional Neural Network feature extraction at time t=0
* "Word embed. t>0" - Word embedding at time t>0
* "LSTM hidden state" - Long Short-Term Memory hidden state
* "Next word"
* "Capt. buffer" - Caption buffer
* "Argmax"
* **Right Side (Chip Architecture):**
* A grid of processing units, arranged in 7 rows and 6 columns.
* The rows are colored in alternating patterns: yellow, green, blue, light blue, pink.
* The grid is enclosed in a purple border.
* Green lines with green dots connect some of the processing units.
* Gray lines connect the "Argmax" block to the bottom row of processing units.
### Detailed Analysis
* **Data Processing Flow (Left Side):**
1. An image (frog) is input.
2. CNN feature extraction occurs at t=0.
3. Word embedding occurs at t>0.
4. The LSTM hidden state is used.
5. The next word is predicted.
6. The caption buffer stores the generated caption.
7. Argmax is used to select the best word.
* **Chip Architecture (Right Side):**
* The chip consists of a 7x6 grid of processing units.
* Each processing unit appears to have a nested square structure.
* The first row is yellow, the second is green, the third is blue, the fourth is light blue, and the fifth and sixth rows are pink.
* Green lines connect processing units within the first three rows.
* Gray lines connect the "Argmax" block to the bottom row of processing units.
### Key Observations
* The diagram illustrates a system for image captioning using a CNN, word embeddings, LSTM, and a chip architecture.
* The chip architecture seems to be designed to process the data in a parallel manner.
* The green lines suggest a specific data flow or communication pattern between processing units.
* The gray lines suggest the "Argmax" operation is performed on the output of the bottom row of processing units.
### Interpretation
The diagram represents a hardware implementation of an image captioning system. The left side shows the software components (CNN, LSTM, etc.), while the right side shows how these components are mapped onto a chip architecture. The chip architecture appears to be designed for parallel processing, which could significantly speed up the captioning process. The specific arrangement of processing units and the connections between them likely reflect the computational requirements of the different software components. The alternating colors of the rows might indicate different functional units or memory regions within the chip. The "Argmax" operation at the end suggests that the chip is responsible for selecting the most likely word to include in the caption.