\n
## Diagram: IBM HERMES Project Chip Implementation
### Overview
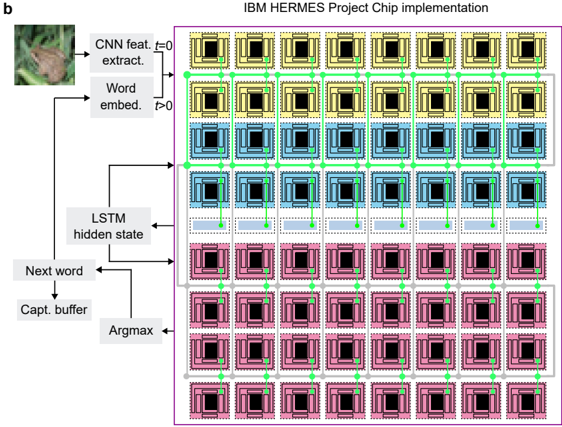
This diagram illustrates the implementation of the IBM HERMES Project Chip, depicting a data flow from an image input through a Convolutional Neural Network (CNN), word embedding, Long Short-Term Memory (LSTM) hidden state, and finally to a next word prediction output. The diagram shows a grid-like structure representing the chip's architecture, with different colored blocks indicating different processing stages.
### Components/Axes
The diagram consists of the following components:
* **Image Input:** A photograph of a mushroom (top-left).
* **CNN Feature Extraction:** Labeled "CNN feat. t=0".
* **Word Embedding:** Labeled "Word embed. t>0".
* **LSTM Hidden State:** Labeled "LSTM hidden state".
* **Next Word:** Labeled "Next word".
* **Capture Buffer:** Labeled "Capt. buffer".
* **Argmax:** Labeled "Argmax".
* **Chip Grid:** A large grid of colored blocks representing the chip's processing units. The grid is approximately 9x8 blocks.
* **Connecting Arrows:** Arrows indicating the flow of data between components.
* **Title:** "IBM HERMES Project Chip implementation" (top-right).
### Detailed Analysis or Content Details
The diagram shows a clear data flow:
1. An image of a mushroom is fed into the CNN feature extraction stage.
2. The CNN output is passed to the word embedding stage.
3. The word embedding is then processed by the LSTM hidden state.
4. The LSTM output leads to the prediction of the "Next word".
5. The "Next word" is stored in a "Capture buffer" and processed by an "Argmax" function.
The chip grid is color-coded to represent different processing stages. The colors are:
* **Yellow:** Approximately 10 blocks in the top rows.
* **Blue:** Approximately 12 blocks in the middle rows.
* **Pink/Red:** Approximately 26 blocks in the lower rows.
* **Gray/White:** The background color of the grid.
Each block within the grid contains a smaller, detailed chip design. The blocks are connected by green lines, suggesting data transfer between them. The arrangement appears to be a structured array, likely representing the physical layout of the chip.
### Key Observations
* The diagram emphasizes the sequential processing of data, starting from image input and ending with word prediction.
* The color-coding of the chip grid suggests different functional units within the chip.
* The grid structure indicates a parallel processing architecture, with multiple processing units working simultaneously.
* The LSTM hidden state appears to be a central component, receiving input from the word embedding and feeding output to the next word prediction stage.
### Interpretation
The diagram illustrates a neural network architecture designed for image-to-text processing, specifically for the IBM HERMES Project. The CNN extracts features from the input image, which are then converted into word embeddings. The LSTM network processes these embeddings to predict the next word in a sequence, likely describing the image content. The chip grid represents the hardware implementation of this architecture, with different colored blocks representing different processing units. The green lines connecting the blocks suggest a data flow network, enabling parallel processing and efficient computation. The diagram suggests a system capable of generating textual descriptions from visual input, potentially for image captioning or visual question answering. The use of LSTM indicates the system is designed to handle sequential data and capture long-range dependencies, crucial for generating coherent and contextually relevant text. The color-coding of the chip grid suggests a modular design, with different functional units optimized for specific tasks.