TECHNICAL ASSET FINGERPRINT
2f74a642a8e0cedd05b617a4
Click to view fullscreen
Press ESC or click to close
FOUND IN PAPERS
EXPERT: healer-alpha-free VERSION 1
RUNTIME: free/openrouter/healer-alpha
INTEL_VERIFIED
## Diagram: IBM HERMES Project Chip Implementation for Neural Network Processing
### Overview
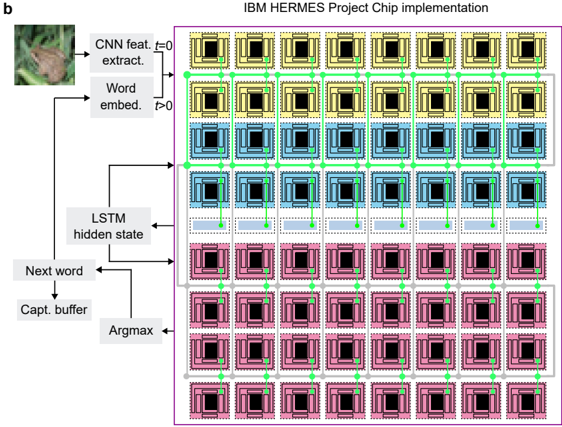
This image is a technical system architecture diagram illustrating the implementation of a neural network model (likely for image captioning) on a specialized hardware chip, the IBM HERMES Project Chip. The diagram is divided into two main sections: a left-side flowchart depicting the algorithmic data flow and a right-side schematic representing the physical chip layout with a grid of processing elements. The overall purpose is to show how a computational model maps onto a hardware architecture.
### Components/Axes
**Header/Title:**
- Top-center: "IBM HERMES Project Chip implementation"
- Top-left corner: Label "b" (likely a figure sub-label).
**Left-Side Algorithmic Flowchart Components:**
1. **Input Image:** A small photograph of a butterfly on a leaf.
2. **Processing Blocks (Text Labels):**
* "CNN feat. extract." (Convolutional Neural Network feature extraction)
* "Word embed." (Word embedding)
* "LSTM hidden state" (Long Short-Term Memory hidden state)
* "Next word"
* "Capt. buffer" (Caption buffer)
* "Argmax"
3. **Temporal Labels:**
* "t=0" (associated with the arrow from the image to "CNN feat. extract.")
* "t>0" (associated with the arrow from "Word embed." to "LSTM hidden state").
**Right-Side Chip Schematic Components:**
1. **Grid Structure:** An 8x8 grid of square units, totaling 64 units.
2. **Unit Design:** Each unit is a square with a black central square surrounded by a colored border. The borders have a layered, concentric appearance.
3. **Color-Coded Rows (from top to bottom):**
* Rows 1 & 2: Yellow borders.
* Rows 3 & 4: Blue borders.
* Rows 5 & 6: Green borders.
* Rows 7 & 8: Pink borders.
4. **Interconnection Network:** A network of green arrows connects the units.
* **Horizontal Arrows:** Connect each unit to its immediate left and right neighbors within the same row.
* **Vertical Arrows:** Connect each unit to the unit directly above and below it within the same column.
* This creates a mesh or grid network topology.
**Spatial Grounding:**
- The algorithmic flowchart is positioned on the left third of the image.
- The chip schematic occupies the right two-thirds, enclosed within a thin purple border.
- The grid is perfectly aligned, with units spaced evenly. The green arrows form a regular, repeating pattern across the entire grid.
### Detailed Analysis
**Algorithmic Flow (Left Side):**
The flow describes a sequence-to-sequence model for image captioning:
1. An input image (butterfly) is processed at time `t=0` by a CNN for feature extraction.
2. At subsequent time steps (`t>0`), word embeddings are fed into an LSTM's hidden state.
3. The LSTM hidden state has bidirectional connections: it receives input from the word embeddings and the previous "Next word" prediction, and it outputs to generate the "Next word."
4. The "Next word" is sent to a "Capt. buffer" (for storing the generated caption sequence) and also to an "Argmax" function (likely to select the most probable word from the output distribution).
**Hardware Mapping (Right Side):**
The 8x8 grid represents the HERMES chip's core array.
- **Color Grouping:** The consistent color by row pairs (2 rows yellow, 2 blue, etc.) suggests a functional or hierarchical grouping of the processing elements. This could indicate different types of cores (e.g., compute vs. memory), different layers of the neural network mapped onto the chip, or different phases of computation.
- **Connectivity:** The green arrow mesh indicates a direct, nearest-neighbor communication network between all adjacent cores. This is a common architecture for parallel processing, allowing efficient data movement for operations like convolutions or matrix multiplications that require data from neighboring elements.
- **Data Flow Correlation:** The arrows from the left-side flowchart (e.g., from "CNN feat. extract." and "LSTM hidden state") point towards the chip grid, implying that these algorithmic functions are executed by the hardware units in the grid. The exact mapping (which color corresponds to which function) is not explicitly labeled.
### Key Observations
1. **Clear Separation of Abstraction:** The diagram cleanly separates the software/model view (left) from the hardware/implementation view (right).
2. **Structured Parallelism:** The hardware is a highly regular, scalable 2D array, ideal for parallelizing the computations inherent in CNNs and LSTMs.
3. **Temporal Unfolding:** The labels "t=0" and "t>0" explicitly show the sequential, time-stepped nature of the LSTM processing, which is a key challenge for efficient hardware implementation.
4. **Color as a Structural Element:** The color coding is the primary visual cue for differentiating sections of the chip, but its specific meaning (e.g., "yellow cores handle convolutions") is not defined in the diagram itself.
5. **Bidirectional LSTM Flow:** The arrows around "LSTM hidden state" correctly depict its recurrent nature, where the state depends on both current input and previous output.
### Interpretation
This diagram serves as a high-level blueprint for deploying a complex, sequential deep learning model onto a specialized, massively parallel hardware accelerator. It demonstrates the **Peircean** relationship between:
- **The Icon:** The grid of squares is an iconic representation of the physical chip layout.
- **The Index:** The arrows index the flow of data and control, both in the algorithm (left) and through the hardware network (right).
- **The Symbol:** The text labels ("CNN," "LSTM") are symbolic, relying on the viewer's knowledge of machine learning terminology.
**What the data suggests:** The implementation strategy involves mapping the parallelizable parts of the neural network (likely the CNN layers and the matrix operations within the LSTM) onto the 2D core array. The mesh network facilitates the data reuse and communication patterns required by these operations. The color grouping may represent a **tiled** or **layered** mapping strategy, where different sections of the chip are dedicated to different stages of the computation pipeline (e.g., feature extraction, sequence processing).
**Notable Anomaly/Outstanding Question:** The diagram does not specify how the sequential, time-dependent nature of the LSTM (the `t>0` loop) is scheduled across the parallel hardware. This is a critical design challenge. The grid's regularity suggests a **systolic array** or **wavefront** processing approach might be used, where data propagates through the cores in a coordinated manner over time.
**Why it matters:** This visualization bridges the gap between AI algorithm design and computer engineering. It highlights the co-design necessary to achieve high efficiency (in speed and power) for AI workloads, moving beyond generic processors to customized silicon like the IBM HERMES chip. The diagram is a tool for communication between software researchers and hardware engineers.
DECODING INTELLIGENCE...