## Diagram: Process Flow Architecture
### Overview
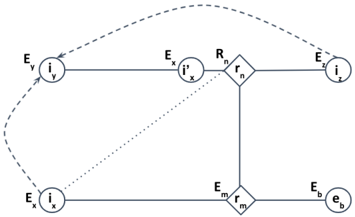
The diagram illustrates a multi-stage process flow with interconnected components, decision nodes, and feedback loops. It includes labeled nodes (e.g., `E_y`, `i_y`, `R_n`), directional arrows, and dashed lines indicating alternative or optional pathways.
### Components/Axes
- **Nodes**:
- **Input/Output Nodes**:
- `E_y`, `E_x`, `E_z`, `E_m`, `E_b` (likely represent events or entities).
- `i_y`, `i'_x`, `i_z`, `i_x`, `e_b` (possibly intermediate states or variables).
- **Process Nodes**:
- `R_n`, `r_m` (diamond-shaped, suggesting decision points or rules).
- **Connections**:
- Solid arrows indicate primary flow (e.g., `E_y → i_y → E_x → i'_x → R_n → i_z → E_z`).
- Dashed lines suggest secondary or conditional pathways (e.g., `E_y → i_y` feedback loop, `i_x → E_m → r_m → E_b`).
### Detailed Analysis
1. **Top Pathway**:
- `E_y` (event) → `i_y` (intermediate state) → `E_x` (event) → `i'_x` (modified state) → `R_n` (decision node) → `i_z` (intermediate state) → `E_z` (event).
- Dashed line from `E_y` back to `i_y` implies a feedback loop or retry mechanism.
2. **Bottom Pathway**:
- `E_x` (event) → `i_x` (intermediate state) → `E_m` (event) → `r_m` (decision node) → `E_b` (event) → `e_b` (final state).
- Dashed line from `i_x` to `E_m` may indicate an optional or parallel process.
3. **Decision Nodes**:
- `R_n` and `r_m` (diamond shapes) likely represent conditional logic (e.g., "if-then" rules) governing transitions between states.
### Key Observations
- **Feedback Loops**: The dashed line from `E_y` to `i_y` suggests iterative processing or error correction.
- **Parallel Paths**: `E_x` splits into two branches: one through `R_n` and another through `r_m`, indicating divergent workflows.
- **Final States**: `E_z` and `e_b` represent terminal outputs, with `e_b` possibly denoting a base or default outcome.
### Interpretation
This diagram likely models a system with:
1. **Sequential Processing**: Primary flow from `E_y` to `E_z` via `R_n`, with intermediate states (`i_y`, `i'_x`, `i_z`).
2. **Conditional Branching**: Decision nodes (`R_n`, `r_m`) dictate transitions based on rules or thresholds.
3. **Redundancy/Alternatives**: Dashed lines imply fallback mechanisms or optional steps (e.g., retrying `i_y` after `E_y`).
The structure emphasizes modularity, with distinct input/output nodes and decision points. The feedback loop at `E_y`/`i_y` highlights resilience, while parallel paths (`E_x`→`R_n` vs. `E_x`→`r_m`) suggest scalability or adaptability in handling events.