\n
## Diagram: State Transition Diagram (Likely for a Control System)
### Overview
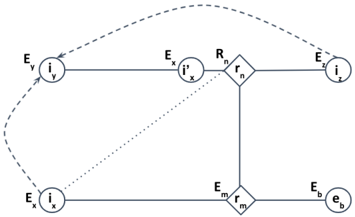
The image depicts a state transition diagram, likely representing the states and transitions within a control system or a similar process. It uses circles to represent states and diamonds to represent decision points or events. Arrows indicate transitions between states, labeled with variables representing the conditions or inputs that trigger those transitions.
### Components/Axes
The diagram consists of the following components:
* **States:** Represented by circles labeled `i_y`, `i_x'`, `i_z`, `i_x`, and `e_b`.
* **Decision Points/Events:** Represented by diamonds labeled `r_n` and `r_m`.
* **Transitions:** Represented by arrows, labeled with variables `E_y`, `E_x`, `R_n`, `E_z`, `E_m`, and `E_b`. Some transitions are dashed, indicating a different type of transition or condition.
* **Labels:** Each state and event is labeled with a unique identifier.
### Detailed Analysis or Content Details
The diagram shows the following connections and transitions:
1. **`i_y` to `i_x'`:** A dashed arrow labeled `E_y` connects state `i_y` to state `i_x'`.
2. **`i_x'` to `r_n`:** A solid arrow labeled `E_x` connects state `i_x'` to event `r_n`.
3. **`r_n` to `i_z`:** A solid arrow labeled `R_n` connects event `r_n` to state `i_z`.
4. **`i_z` to `i_x'`:** A solid arrow labeled `E_z` connects state `i_z` to state `i_x'`.
5. **`i_x` to `r_m`:** A solid arrow labeled `E_x` connects state `i_x` to event `r_m`.
6. **`r_m` to `e_b`:** A solid arrow labeled `E_m` connects event `r_m` to state `e_b`.
7. **`e_b` to `i_x`:** A solid arrow labeled `E_b` connects state `e_b` to state `i_x`.
8. **`i_y` to `r_n`:** A dashed arrow connects state `i_y` to event `r_n`.
### Key Observations
* The diagram contains a loop involving states `i_x'`, `r_n`, and `i_z`.
* The dashed arrows (`E_y` from `i_y` to `i_x'`) and (`i_y` to `r_n`) suggest alternative or conditional transitions.
* The diagram appears to represent a cyclical process, with transitions between states and decision points.
* The variables `E_x`, `E_y`, `E_z`, `E_m`, `E_b`, and `R_n` likely represent events or conditions that trigger the transitions.
### Interpretation
This diagram likely represents a control system or a state machine. The states (`i_y`, `i_x'`, `i_z`, `i_x`, `e_b`) could represent different operational modes or conditions of the system. The events (`r_n`, `r_m`) represent decision points where the system's behavior changes based on certain criteria.
The dashed lines suggest that the transition from `i_y` can either go directly to `i_x'` or to `r_n`, depending on some condition not explicitly shown in the diagram. The loop involving `i_x'`, `r_n`, and `i_z` suggests a feedback mechanism or a repeating process.
The variables `E_x`, `E_y`, etc., likely represent input signals or events that trigger the transitions. For example, `E_x` might represent a signal indicating that a certain condition has been met, causing the system to transition from `i_x'` to `r_n`.
Without further context, it's difficult to determine the specific function of this system. However, the diagram provides a clear visual representation of the states, transitions, and decision points involved in its operation. The diagram is a high-level abstraction and does not provide details about the internal workings of each state or the specific logic used to evaluate the conditions for transitions.