## Bar Chart: Violation Counts by Grammatical Structure (Baseline vs MLNN)
### Overview
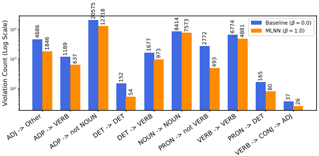
The chart compares violation counts (on a logarithmic scale) between two models: Baseline (β=0.0) and MLNN (β=1.0) across 10 grammatical structure categories. The y-axis uses a log scale (10–1000), and the x-axis lists grammatical relationships (e.g., "Adj -> Other", "ADP -> VERB").
### Components/Axes
- **X-axis**: Grammatical structure categories (10 total):
1. Adj -> Other
2. ADP -> VERB
3. ADP -> not NOUN
4. DET -> DET
5. DET -> VERB
6. NOUN -> NOUN
7. PRON -> not VERB
8. VERB -> VERB
9. PRON -> DET
10. VERB -> CONJ -> ADJ
- **Y-axis**: Violation Count (Log Scale, 10–1000)
- **Legend**:
- Blue bars: Baseline (β=0.0)
- Orange bars: MLNN (β=1.0)
- **Legend Position**: Top-right corner
### Detailed Analysis
1. **Adj -> Other**:
- Baseline: 4,686
- MLNN: 1,846
2. **ADP -> VERB**:
- Baseline: 1,109
- MLNN: 637
3. **ADP -> not NOUN**:
- Baseline: 30,573 (highest)
- MLNN: 12,318
4. **DET -> DET**:
- Baseline: 152
- MLNN: 54
5. **DET -> VERB**:
- Baseline: 1,677
- MLNN: 973
6. **NOUN -> NOUN**:
- Baseline: 8,414
- MLNN: 7,573
7. **PRON -> not VERB**:
- Baseline: 2,772
- MLNN: 493
8. **VERB -> VERB**:
- Baseline: 6,774
- MLNN: 4,881
9. **PRON -> DET**:
- Baseline: 165
- MLNN: 80
10. **VERB -> CONJ -> ADJ**:
- Baseline: 37
- MLNN: 26
### Key Observations
- **Baseline Dominance**: Baseline violations consistently exceed MLNN across all categories, with the largest gap in "ADP -> not NOUN" (30,573 vs 12,318).
- **MLNN Reduction**: MLNN reduces violations by 50–90% in most categories (e.g., "Adj -> Other" drops from 4,686 to 1,846).
- **Lowest Violations**: "VERB -> CONJ -> ADJ" has the smallest counts (37 vs 26), suggesting both models perform well here.
- **Outlier**: "ADP -> not NOUN" has the highest violation count for Baseline, indicating potential grammatical ambiguity in this structure.
### Interpretation
The data demonstrates that MLNN significantly reduces grammatical violations compared to Baseline, particularly in complex structures like "ADP -> not NOUN" and "PRON -> not VERB". The logarithmic scale emphasizes the disparity in violation magnitudes, with MLNN showing stronger performance in high-violation categories. The minimal violations in "VERB -> CONJ -> ADJ" suggest this structure is inherently less ambiguous. The consistent trend across categories implies MLNN’s β=1.0 parameter effectively constrains ungrammatical constructions.