## Heatmap: Latent State Convergence ||x - x*||
### Overview
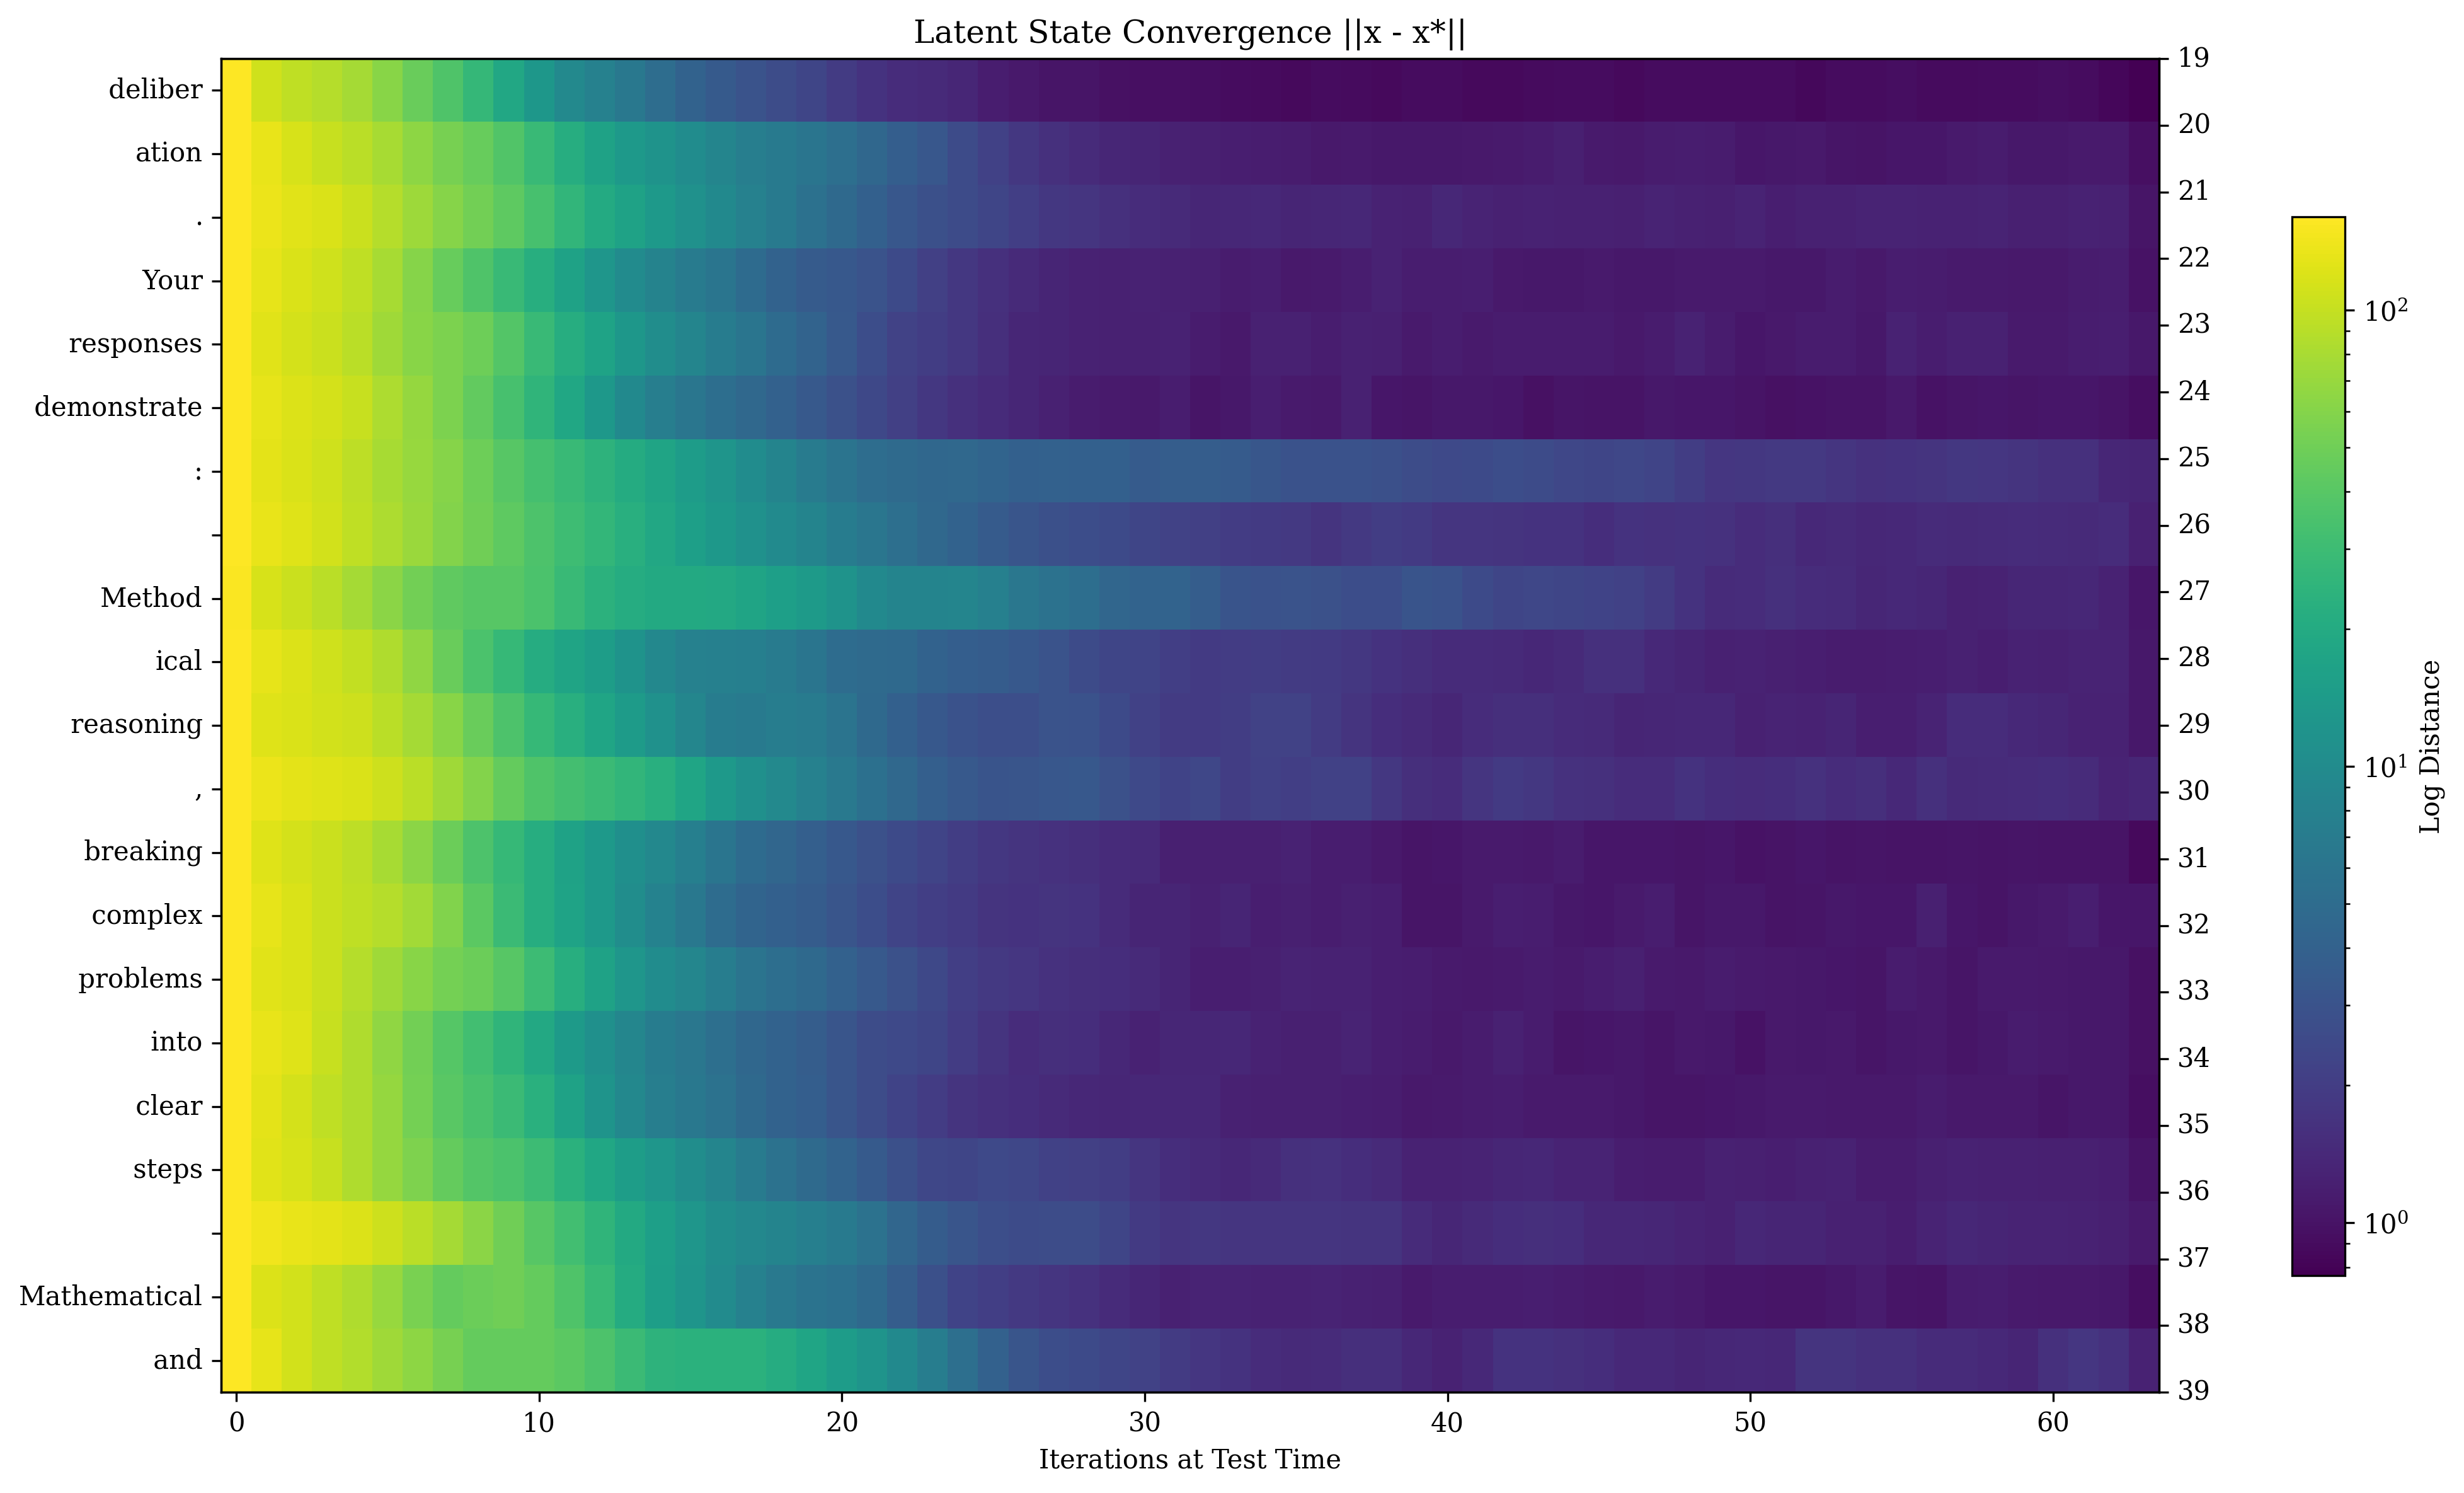
The image is a heatmap visualizing the convergence of latent states, represented by the distance between 'x' and 'x*'. The x-axis represents iterations at test time, and the y-axis represents different text prompts. The color intensity indicates the log distance, with yellow representing higher distances and dark purple representing lower distances.
### Components/Axes
* **Title:** Latent State Convergence ||x - x*||
* **X-axis:** Iterations at Test Time, ranging from 0 to 60 in increments of 10.
* **Y-axis:** Text prompts:
* deliber
* ation
* .
* Your
* responses
* demonstrate
* :
* Method
* ical
* reasoning
* ,
* breaking
* complex
* problems
* into
* clear
* steps
* Mathematical
* and
* **Right Y-axis:** Numerical labels from 19 to 39, incrementing by 1.
* **Colorbar (Log Distance):** Ranges from 10^0 to 10^2, indicating the magnitude of the log distance.
### Detailed Analysis
The heatmap shows how the log distance changes over iterations for each text prompt.
* **General Trend:** The log distance generally decreases as the number of iterations increases, indicating convergence. The left side of the heatmap is predominantly yellow/green, while the right side is predominantly purple.
* **Specific Observations:**
* For the text prompts "deliber" through "reasoning", the log distance starts high (yellow) and decreases more rapidly in the first 10-20 iterations, then slows down.
* For the text prompts "breaking" through "and", the log distance also starts high but appears to converge more slowly and less consistently.
* There are some localized areas of higher log distance (yellow/green) even at higher iteration counts, suggesting that convergence is not uniform across all prompts and iterations.
### Key Observations
* The initial log distance varies across different text prompts.
* The rate of convergence differs across text prompts.
* Some text prompts converge more smoothly than others.
* The log distance generally decreases with increasing iterations, indicating convergence.
### Interpretation
The heatmap visualizes the convergence behavior of a latent state model for different text prompts. The color intensity represents the log distance between the current state and a target state. The data suggests that the model converges, but the rate and smoothness of convergence depend on the specific text prompt. Some prompts converge quickly and smoothly, while others converge more slowly and with more variability. This could be due to differences in the complexity or ambiguity of the prompts, or to the model's ability to represent them effectively in the latent space. The numerical labels on the right y-axis do not appear to have a direct correlation to the text prompts on the left y-axis, and may represent an arbitrary indexing or ordering.