\n
## Heatmap: Latent State Convergence ||x - x*||
### Overview
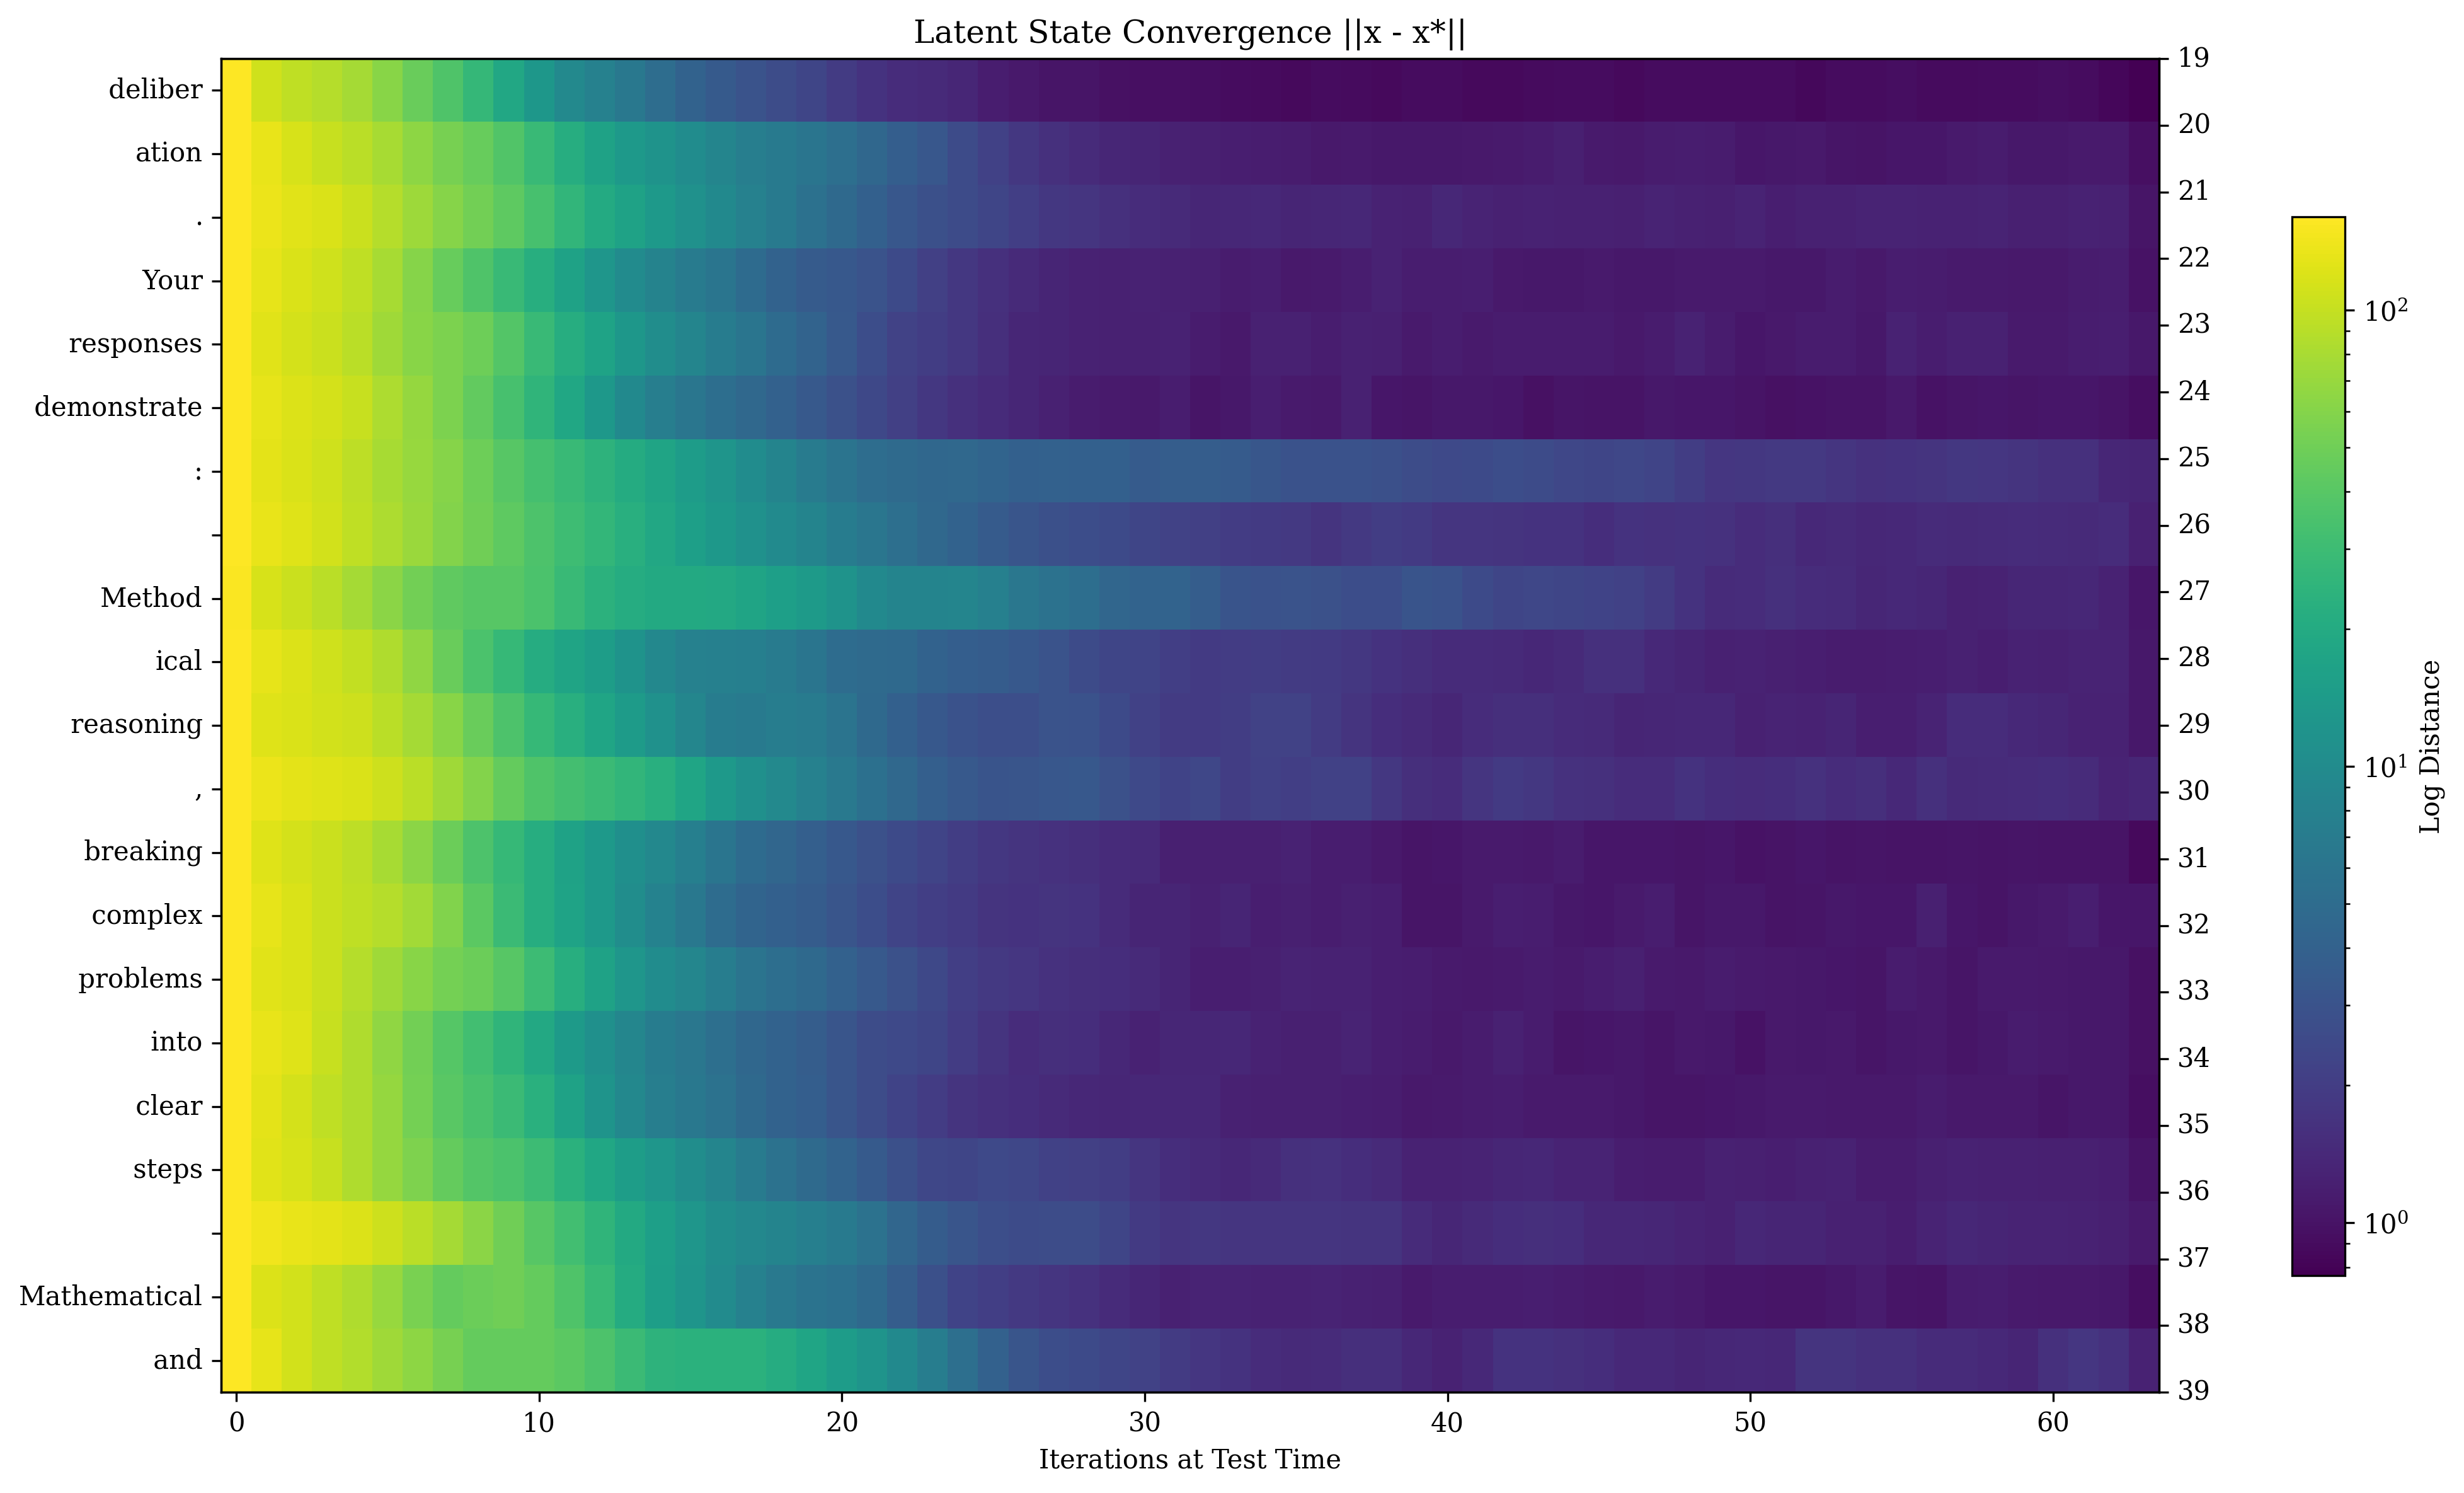
This image presents a heatmap visualizing the "Latent State Convergence ||x - x*||" across different iterations at test time and different prompts. The color intensity represents the "Log Distance" between the latent state and the target latent state (denoted as x and x* respectively). The heatmap displays how quickly and effectively the model converges to a stable latent state for various prompts as the number of iterations increases.
### Components/Axes
* **X-axis:** "Iterations at Test Time" ranging from 0 to 60, with markers at every 10 iterations.
* **Y-axis:** A list of prompts, including:
* "deliberation"
* "Your responses demonstrate"
* "Methodical reasoning"
* "breaking complex problems into clear steps"
* "Mathematical and"
* **Color Scale (Legend):** Located on the right side of the heatmap, representing "Log Distance". The scale ranges from approximately 19 (dark blue) to 39 (dark green), with intermediate values indicated. The scale is logarithmic (10^0 to 10^2).
### Detailed Analysis
The heatmap shows a clear trend of decreasing "Log Distance" (convergence) as the number of "Iterations at Test Time" increases. The color transitions from warm colors (green, yellow) at low iteration counts to cool colors (purple, dark blue) at higher iteration counts.
Here's a breakdown of the convergence behavior for each prompt, based on color intensity:
* **"deliberation"**: Starts with a Log Distance around 22-23 at 0 iterations, decreasing to approximately 20-21 at 60 iterations.
* **"Your responses demonstrate"**: Starts around 23-24, decreasing to 21-22 at 60 iterations.
* **"Methodical reasoning"**: Starts around 24-25, decreasing to 22-23 at 60 iterations.
* **"breaking complex problems into clear steps"**: Starts around 26-27, decreasing to 24-25 at 60 iterations.
* **"Mathematical and"**: Starts around 28-29, decreasing to 26-27 at 60 iterations.
The convergence appears to be fastest for the "deliberation" prompt, as indicated by the earlier transition to cooler colors. The "Mathematical and" prompt exhibits the slowest convergence, remaining in warmer colors for a longer duration.
### Key Observations
* All prompts demonstrate convergence as the number of iterations increases.
* The "Mathematical and" prompt consistently shows higher "Log Distance" values compared to other prompts, indicating slower convergence.
* The convergence rate appears to decrease with increasing iterations. The difference in color intensity between 0 and 10 iterations is more pronounced than between 50 and 60 iterations.
* There are some minor variations in convergence within each prompt, suggesting potential sensitivity to initial conditions or other factors.
### Interpretation
The heatmap suggests that the model's ability to converge to a stable latent state is influenced by the prompt used. Prompts requiring more complex reasoning or mathematical skills ("Mathematical and") take longer to converge than prompts focused on deliberation or general responses. The logarithmic scale indicates that the initial stages of iteration have the most significant impact on reducing the distance between the latent state and the target state. The decreasing convergence rate at higher iterations suggests that the model approaches a limit where further iterations yield diminishing returns. This data could be used to optimize the number of iterations used during inference, balancing convergence accuracy with computational cost. The difference in convergence rates between prompts could also inform prompt engineering strategies to improve model performance on challenging tasks.