## Diagram: CatBoost Training Variations
### Overview
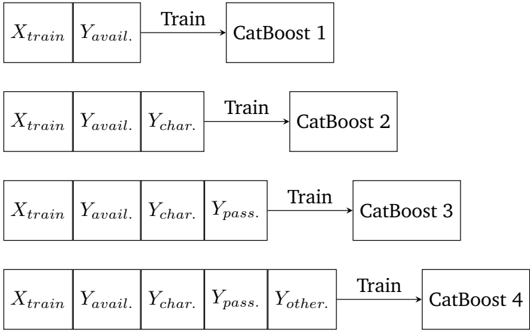
The image is a diagram illustrating four different training configurations for a CatBoost model. Each configuration uses a different set of input features, progressively adding more features to the training data. The diagram shows the flow of data from input features to the CatBoost model through a "Train" process.
### Components/Axes
* **Input Features (Left Side):** Each row starts with a set of input features, represented as rectangular boxes.
* `Xtrain`: Training data. Present in all configurations.
* `Yavail.`: Available target variable. Present in all configurations.
* `Ychar.`: Characteristic target variable. Present in configurations 2, 3, and 4.
* `Ypass.`: Passenger target variable. Present in configurations 3 and 4.
* `Yother.`: Other target variable. Present only in configuration 4.
* **Training Process (Middle):** An arrow labeled "Train" indicates the training process.
* **CatBoost Model (Right Side):** A rectangular box represents the CatBoost model.
* `CatBoost 1`: Model trained with `Xtrain` and `Yavail.`
* `CatBoost 2`: Model trained with `Xtrain`, `Yavail.`, and `Ychar.`
* `CatBoost 3`: Model trained with `Xtrain`, `Yavail.`, `Ychar.`, and `Ypass.`
* `CatBoost 4`: Model trained with `Xtrain`, `Yavail.`, `Ychar.`, `Ypass.`, and `Yother.`
### Detailed Analysis or Content Details
* **Configuration 1:** `Xtrain`, `Yavail.` -> Train -> `CatBoost 1`
* **Configuration 2:** `Xtrain`, `Yavail.`, `Ychar.` -> Train -> `CatBoost 2`
* **Configuration 3:** `Xtrain`, `Yavail.`, `Ychar.`, `Ypass.` -> Train -> `CatBoost 3`
* **Configuration 4:** `Xtrain`, `Yavail.`, `Ychar.`, `Ypass.`, `Yother.` -> Train -> `CatBoost 4`
### Key Observations
* The diagram shows a progressive addition of target variables to the training data.
* Each configuration trains a separate CatBoost model.
* The `Xtrain` and `Yavail.` features are common to all training configurations.
### Interpretation
The diagram illustrates an experiment where different CatBoost models are trained using progressively more target variables. The goal is likely to determine the impact of each target variable on the model's performance. By comparing the performance of `CatBoost 1` through `CatBoost 4`, one can assess the importance of `Ychar.`, `Ypass.`, and `Yother.` in predicting the target outcome. The diagram suggests a systematic approach to feature selection and model optimization.