## Diagram: Incremental Feature Training Pipelines for CatBoost Models
### Overview
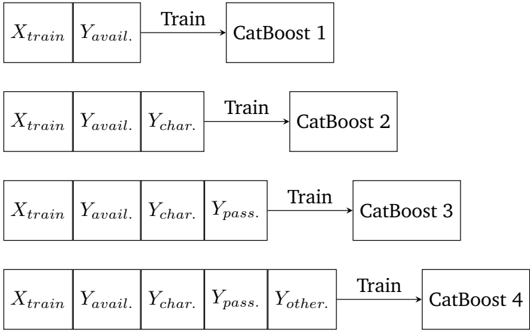
The image displays a technical diagram illustrating four distinct machine learning training pipelines. Each pipeline represents a sequential, incremental approach to training a CatBoost model, where each subsequent model is trained on an expanded set of input features. The diagram is structured as four horizontal rows, each depicting a training process.
### Components/Axes
The diagram consists of the following repeating components arranged in a left-to-right flow for each row:
1. **Input Data Blocks:** Rectangular boxes on the left containing mathematical notation for feature sets.
2. **Process Arrow:** A right-pointing arrow labeled with the action "Train".
3. **Model Output Block:** A rectangular box on the right containing the model identifier.
**Labels and Notation:**
* `X_train`: Represents the primary training feature matrix.
* `Y_avail.`: Likely denotes "available" target variables or labels.
* `Y_char.`: Likely denotes "characteristic" features or targets.
* `Y_pass.`: Likely denotes "passenger" or "passage" related features or targets.
* `Y_other.`: Represents an additional, unspecified category of features or targets.
* `CatBoost 1`, `CatBoost 2`, `CatBoost 3`, `CatBoost 4`: Identifiers for four distinct models trained in sequence.
### Detailed Analysis
The diagram details four training configurations, processed from top to bottom:
1. **Row 1 (Top):**
* **Input:** `[X_train | Y_avail.]`
* **Process:** Arrow labeled "Train" points from input to model.
* **Output:** `CatBoost 1`
* **Description:** The baseline model is trained using the core training features (`X_train`) and available targets (`Y_avail.`).
2. **Row 2:**
* **Input:** `[X_train | Y_avail. | Y_char.]`
* **Process:** Arrow labeled "Train".
* **Output:** `CatBoost 2`
* **Description:** The second model incorporates an additional feature set, `Y_char.`, on top of the inputs used for CatBoost 1.
3. **Row 3:**
* **Input:** `[X_train | Y_avail. | Y_char. | Y_pass.]`
* **Process:** Arrow labeled "Train".
* **Output:** `CatBoost 3`
* **Description:** The third model further expands the feature set by adding `Y_pass.` to the inputs used for CatBoost 2.
4. **Row 4 (Bottom):**
* **Input:** `[X_train | Y_avail. | Y_char. | Y_pass. | Y_other.]`
* **Process:** Arrow labeled "Train".
* **Output:** `CatBoost 4`
* **Description:** The final and most comprehensive model is trained using all previously mentioned feature sets plus an additional `Y_other.` set.
### Key Observations
* **Incremental Complexity:** There is a clear, linear progression in model complexity. Each model (CatBoost 1 through 4) is trained on a strictly superset of the features used to train the previous model.
* **Modular Feature Addition:** The diagram visually isolates each new feature set (`Y_char.`, `Y_pass.`, `Y_other.`) as a distinct block being appended to the input pipeline.
* **Consistent Structure:** All four pipelines follow an identical visual and logical structure, emphasizing the comparative nature of the experiment or process.
### Interpretation
This diagram outlines a controlled experiment or a production pipeline designed to evaluate the **incremental value of different data sources or feature groups** on the performance of a CatBoost model.
* **What it Suggests:** The setup is methodologically sound for conducting an **ablation study**. By comparing the performance metrics (e.g., accuracy, F1-score) of `CatBoost 1` against `CatBoost 2`, one can isolate the predictive power contributed by the `Y_char.` features. Similarly, comparing `CatBoost 2` to `CatBoost 3` reveals the marginal contribution of `Y_pass.` features, and so on.
* **Relationships:** The elements are related in a strict, additive hierarchy. `CatBoost 4` represents the full model, while `CatBoost 1` is the simplest baseline. The performance delta between consecutive models quantifies the importance of each added feature block.
* **Underlying Purpose:** This approach is critical for feature engineering and model optimization. It helps answer questions such as: "Are the `Y_pass.` features worth the computational cost of collecting and processing them?" or "Does adding `Y_other.` features lead to significant performance gains or does it introduce noise?" The diagram itself does not show results, but it defines the experimental framework to obtain them.