## Chart: Average Temperature and Electric Field in CMO Layer vs. Voltage
### Overview
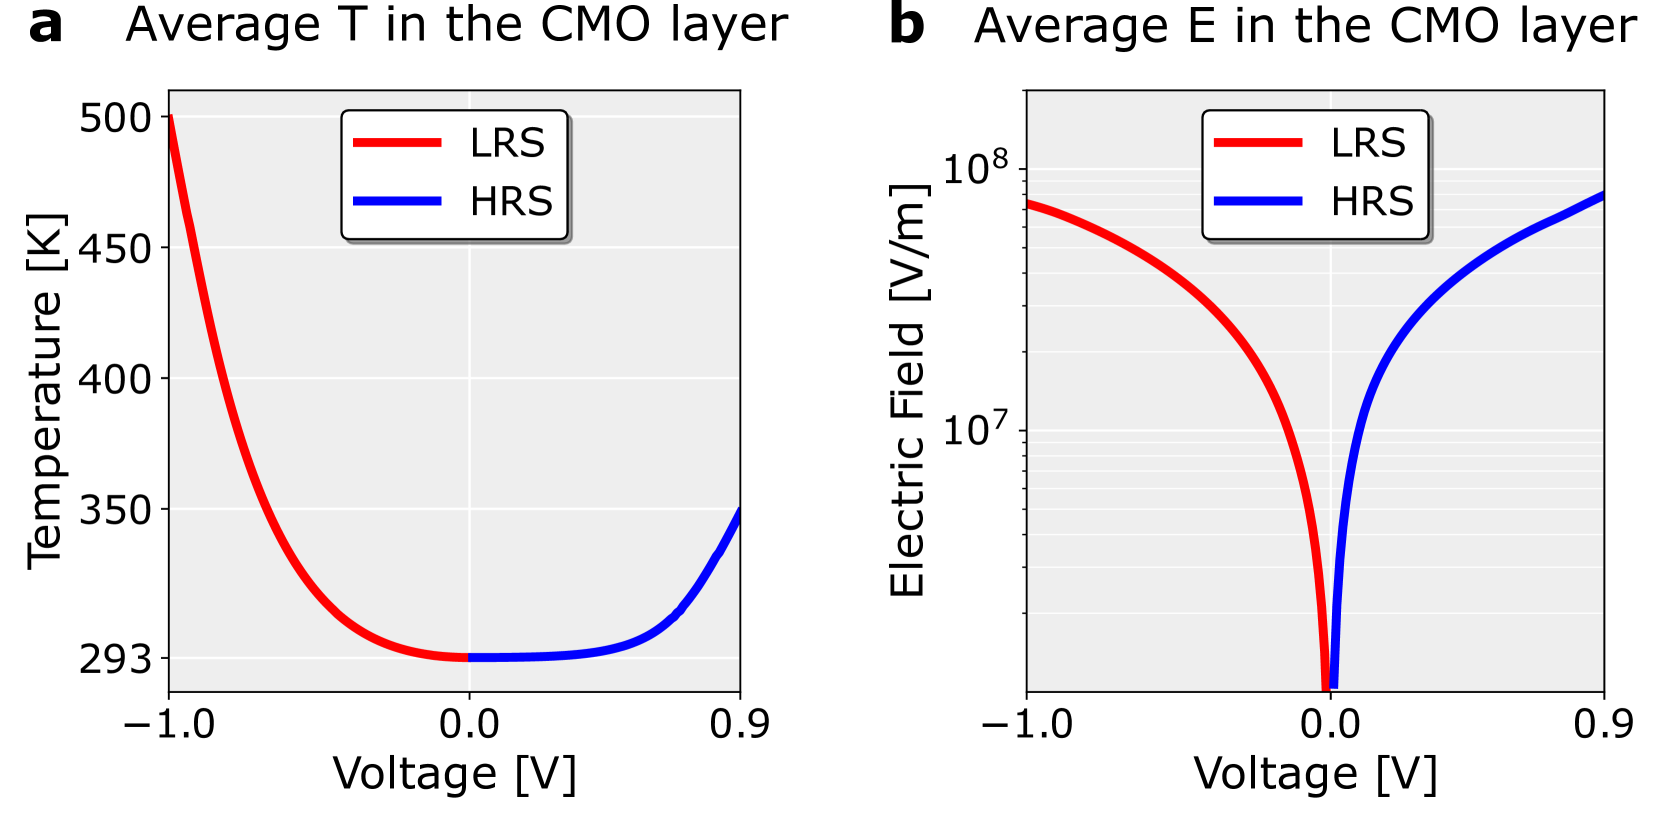
The image presents two line graphs comparing the average temperature (T) and electric field (E) in the CMO layer as a function of voltage. The graphs show the behavior of two states: Low Resistance State (LRS) and High Resistance State (HRS). The left graph displays temperature in Kelvin (K), while the right graph displays the electric field in Volts per meter (V/m) on a logarithmic scale.
### Components/Axes
**Left Graph (Average T in the CMO layer):**
* **Title:** a Average T in the CMO layer
* **Y-axis:** Temperature [K]
* Scale: Linear, ranging from approximately 293 K to 500 K.
* Markers: 293, 350, 400, 450, 500
* **X-axis:** Voltage [V]
* Scale: Linear, ranging from -1.0 V to 0.9 V.
* Markers: -1.0, 0.0, 0.9
* **Legend:** Located in the top-right corner.
* LRS (Low Resistance State): Represented by a red line.
* HRS (High Resistance State): Represented by a blue line.
**Right Graph (Average E in the CMO layer):**
* **Title:** b Average E in the CMO layer
* **Y-axis:** Electric Field [V/m]
* Scale: Logarithmic (base 10), ranging from approximately 10^7 to 10^8 V/m.
* Markers: 10^7, 10^8
* **X-axis:** Voltage [V]
* Scale: Linear, ranging from -1.0 V to 0.9 V.
* Markers: -1.0, 0.0, 0.9
* **Legend:** Located in the top-right corner.
* LRS (Low Resistance State): Represented by a red line.
* HRS (High Resistance State): Represented by a blue line.
### Detailed Analysis
**Left Graph (Average T in the CMO layer):**
* **LRS (Red Line):**
* Trend: Starts at approximately 500 K at -1.0 V, decreases rapidly to approximately 293 K near 0.0 V.
* Data Points:
* (-1.0 V, 500 K)
* (0.0 V, 293 K)
* **HRS (Blue Line):**
* Trend: Remains constant at approximately 293 K from 0.0 V to -0.2V, then increases to approximately 340 K at 0.9 V.
* Data Points:
* (0.0 V, 293 K)
* (0.9 V, 340 K)
**Right Graph (Average E in the CMO layer):**
* **LRS (Red Line):**
* Trend: Starts at approximately 10^8 V/m at -1.0 V, decreases rapidly to approximately 10^7 V/m near 0.0 V.
* Data Points:
* (-1.0 V, 10^8 V/m)
* (0.0 V, 10^7 V/m)
* **HRS (Blue Line):**
* Trend: Starts at approximately 10^7 V/m at 0.0 V, increases rapidly to approximately 8 * 10^7 V/m at 0.9 V.
* Data Points:
* (0.0 V, 10^7 V/m)
* (0.9 V, 8 * 10^7 V/m)
### Key Observations
* In the temperature graph, the LRS exhibits a significant temperature drop as voltage approaches 0 V, while the HRS maintains a relatively constant low temperature.
* In the electric field graph, the LRS shows a sharp decrease in electric field as voltage approaches 0 V, while the HRS shows a sharp increase in electric field as voltage increases from 0 V to 0.9 V.
* Both graphs show a distinct change in behavior around 0 V, suggesting a switching point or transition region between the two resistance states.
### Interpretation
The graphs illustrate the relationship between voltage, temperature, and electric field within the CMO layer for two distinct resistance states (LRS and HRS). The data suggests that the LRS is characterized by high temperature and high electric field at negative voltages, which rapidly decrease as the voltage approaches zero. Conversely, the HRS maintains a low temperature and low electric field near zero voltage, with the electric field increasing as the voltage becomes more positive. This behavior is indicative of a voltage-controlled switching mechanism within the CMO layer, where the material transitions between high and low resistance states depending on the applied voltage. The sharp changes observed near 0 V suggest a critical voltage threshold for this switching behavior.