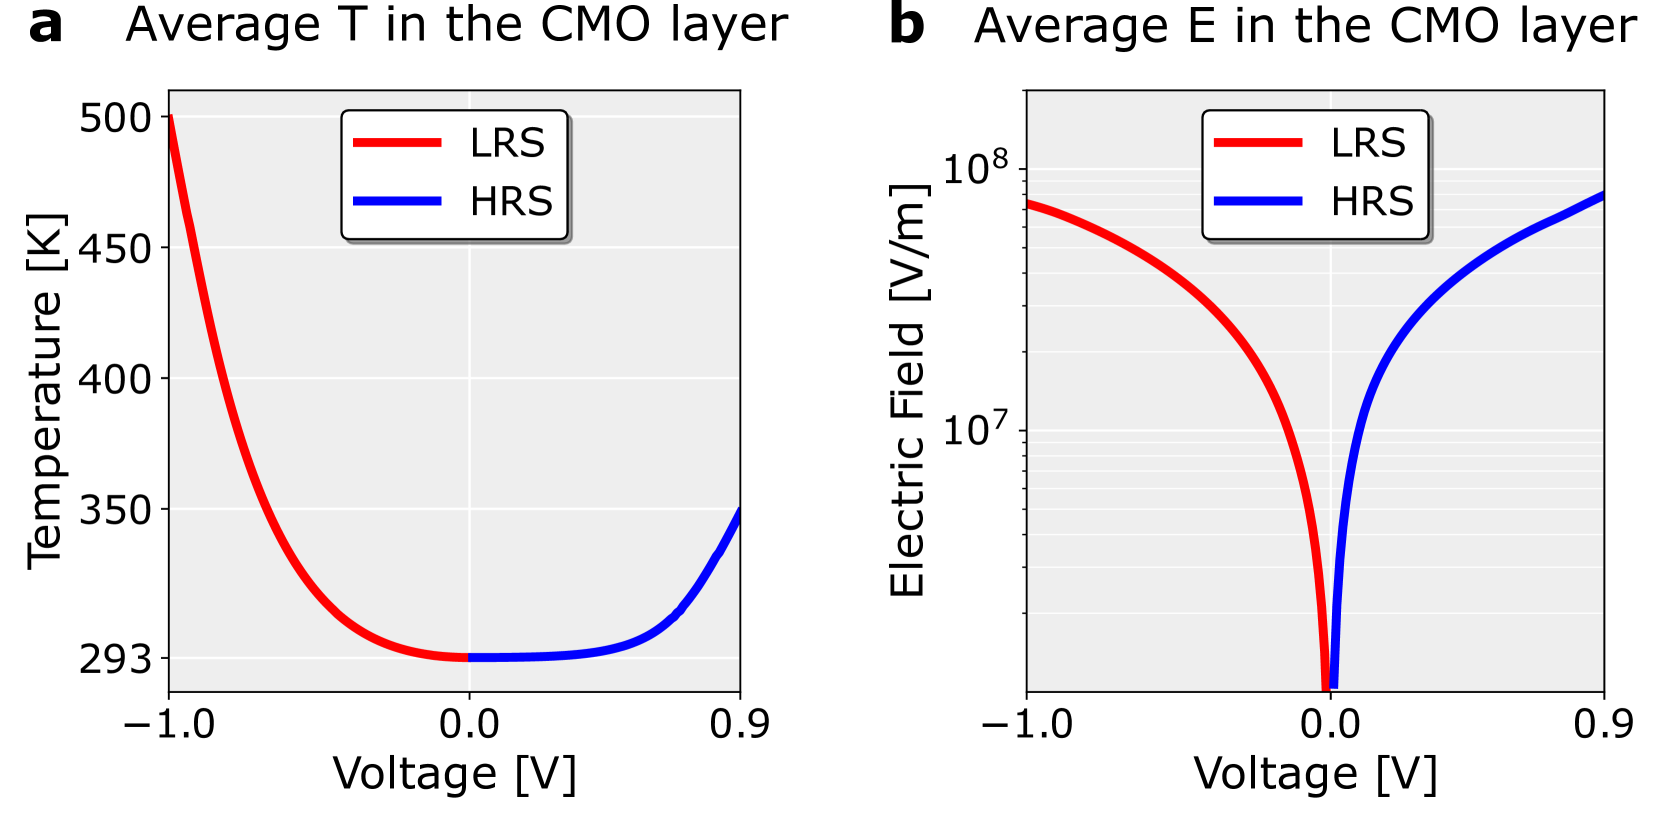
## Charts: Average Temperature and Electric Field in the CMO Layer
### Overview
The image presents two charts, labeled 'a' and 'b', both depicting the relationship between Voltage and either Temperature or Electric Field within a CMO layer. Chart 'a' shows Average Temperature (T) versus Voltage, while chart 'b' shows Average Electric Field (E) versus Voltage. Both charts compare two states: Low Resistance State (LRS) and High Resistance State (HRS).
### Components/Axes
**Chart a: Average T in the CMO layer**
* **X-axis:** Voltage [V], ranging from approximately -1.0 to 0.9.
* **Y-axis:** Temperature [K], ranging from approximately 250 to 500.
* **Legend:**
* LRS (Low Resistance State) - Red line
* HRS (High Resistance State) - Blue line
**Chart b: Average E in the CMO layer**
* **X-axis:** Voltage [V], ranging from approximately -1.0 to 0.9.
* **Y-axis:** Electric Field [V/m], displayed on a logarithmic scale from approximately 10<sup>6</sup> to 10<sup>8</sup>.
* **Legend:**
* LRS (Low Resistance State) - Red line
* HRS (High Resistance State) - Blue line
The legends are positioned in the top-left corner of each chart.
### Detailed Analysis or Content Details
**Chart a: Average T in the CMO layer**
* **LRS (Red Line):** The temperature starts at approximately 480 K at -1.0 V, rapidly decreases to a minimum of approximately 260 K at around 0.1 V, and then increases again to approximately 320 K at 0.9 V. The trend is a sharp dip followed by a gradual rise.
* **HRS (Blue Line):** The temperature starts at approximately 280 K at -1.0 V, gradually decreases to a minimum of approximately 260 K at 0.0 V, and then rapidly increases to approximately 450 K at 0.9 V. The trend is a slow decrease followed by a sharp rise.
**Chart b: Average E in the CMO layer**
* **LRS (Red Line):** The electric field starts at approximately 9.0 x 10<sup>7</sup> V/m at -1.0 V, remains relatively constant around 8.0 x 10<sup>7</sup> V/m until approximately 0.0 V, and then rapidly increases to approximately 9.5 x 10<sup>7</sup> V/m at 0.9 V. The trend is relatively flat with a slight increase.
* **HRS (Blue Line):** The electric field starts at approximately 1.0 x 10<sup>7</sup> V/m at -1.0 V, rapidly increases to approximately 8.0 x 10<sup>7</sup> V/m at 0.0 V, and then continues to increase to approximately 9.0 x 10<sup>7</sup> V/m at 0.9 V. The trend is a sharp increase followed by a more gradual increase.
### Key Observations
* In Chart a, the LRS exhibits a much more pronounced temperature dip around 0.1 V compared to the HRS.
* In Chart b, the HRS experiences a much more significant increase in electric field around 0.0 V compared to the LRS.
* Both charts show a divergence in behavior between LRS and HRS as the voltage approaches 0.9 V.
* The Y-axis for Chart b is logarithmic, highlighting the large changes in electric field.
### Interpretation
These charts demonstrate the differing thermal and electrical responses of the CMO layer in Low Resistance State (LRS) and High Resistance State (HRS) as a function of applied voltage. The temperature dip in LRS (Chart a) suggests a phase change or energy dissipation mechanism occurring at low voltages. The rapid increase in electric field in HRS (Chart b) around 0.0 V indicates a breakdown or switching event.
The contrasting behaviors suggest that the LRS and HRS represent distinct physical states of the CMO layer, likely related to the material's resistive switching properties. The data suggests that applying a voltage near 0.0 V can induce a transition between these states, as evidenced by the sharp changes in both temperature and electric field. The logarithmic scale on Chart b emphasizes the substantial electric field changes associated with the HRS, indicating a significant change in the material's conductivity. The divergence at 0.9V could indicate a saturation point or a limit to the material's response.