## Line Chart: Average Reward vs. Training Steps
### Overview
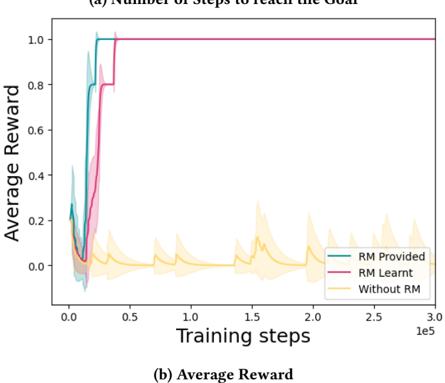
This image displays a line chart comparing the performance of three different reinforcement learning configurations over the course of 300,000 training steps. The chart tracks "Average Reward" on the Y-axis against "Training steps" on the X-axis.
**Note on Discrepancy:** There is a contradiction in the provided image labels. The top header reads "(a) Number of Steps to reach the Goal", while the bottom caption reads "(b) Average Reward". Given that the Y-axis is explicitly labeled "Average Reward" and the data ranges from 0.0 to 1.0 (typical for normalized reward), the bottom caption "(b) Average Reward" is the accurate descriptor.
### Components/Axes
* **X-Axis:** Labeled "Training steps". The scale ranges from 0.0 to 3.0, with a multiplier of $10^5$ (indicated as "1e5" at the far right). This represents a total of 300,000 steps.
* **Y-Axis:** Labeled "Average Reward". The scale ranges from 0.0 to 1.0.
* **Legend:** Located in the bottom-right quadrant of the chart area.
* **RM Provided (Teal/Dark Cyan):** Represents the agent using a provided Reward Model.
* **RM Learnt (Magenta/Pink):** Represents the agent using a learned Reward Model.
* **Without RM (Yellow/Orange):** Represents the baseline agent without a Reward Model.
* **Shaded Regions:** Surrounding each line are semi-transparent shaded regions representing the variance or confidence interval of the data.
### Detailed Analysis
#### 1. RM Provided (Teal Line)
* **Trend:** This series shows the fastest convergence. It begins with a brief dip, followed by a sharp, near-vertical ascent to the maximum reward.
* **Data Points:**
* Starts at approximately 0.2 reward.
* Dips to a minimum of ~0.05 at roughly 0.1e5 (10,000) steps.
* Ascends sharply starting at ~0.15e5 (15,000) steps.
* Reaches a plateau of 1.0 at approximately 0.25e5 (25,000) steps and remains constant for the duration of the training.
#### 2. RM Learnt (Magenta Line)
* **Trend:** This series shows a slightly delayed convergence compared to "RM Provided" but follows a similar trajectory.
* **Data Points:**
* Starts at approximately 0.2 reward.
* Dips to a minimum of ~0.02 at roughly 0.15e5 (15,000) steps.
* Ascends sharply starting at ~0.2e5 (20,000) steps.
* Reaches a plateau of 1.0 at approximately 0.4e5 (40,000) steps and remains constant for the duration of the training.
#### 3. Without RM (Yellow Line)
* **Trend:** This series exhibits a "sawtooth" pattern, indicating a failure to converge to a stable, high-reward policy.
* **Data Points:**
* Starts at approximately 0.2 reward.
* Drops rapidly to near 0.0 within the first 0.2e5 (20,000) steps.
* Throughout the remaining training (up to 3.0e5), it exhibits periodic, short-lived spikes in reward (reaching peaks of ~0.1 to 0.2) followed by a decay back toward 0.0.
### Key Observations
* **Performance Gap:** There is a massive performance disparity between the agents using Reward Models (RM) and the agent without one. The RM agents achieve optimal performance (1.0 reward) very early in training.
* **Convergence Speed:** The "RM Provided" agent converges faster than the "RM Learnt" agent, suggesting that a ground-truth or pre-defined reward model is more efficient than one that must be learned during the process.
* **Baseline Failure:** The "Without RM" agent fails to learn the task effectively. The periodic spikes suggest the agent occasionally stumbles upon the goal by chance, but fails to consolidate this into a stable policy, leading to the observed "forgetting" or instability.
### Interpretation
This chart demonstrates the critical importance of **Reward Shaping** or **Reward Modeling** in reinforcement learning environments where the goal is sparse.
* **The "Without RM" scenario:** This likely represents a "sparse reward" environment. The agent only receives a reward when it reaches the goal. Because the goal is difficult to find by random exploration, the agent spends most of its time receiving zero reward. The periodic spikes are likely "lucky" episodes where the agent reaches the goal, but because it hasn't learned a robust policy, it cannot replicate this success consistently.
* **The "RM" scenarios:** By providing a Reward Model (either provided or learnt), the environment is transformed into a "dense reward" problem. The agent receives intermediate feedback (shaping rewards) that guides it toward the goal, allowing for rapid policy optimization.
* **Conclusion:** The data suggests that in this specific environment, learning without a reward model is practically infeasible, while using a reward model—even one that must be learned—allows for successful and stable task completion.