## Line Chart: Average Reward vs. Training Steps
### Overview
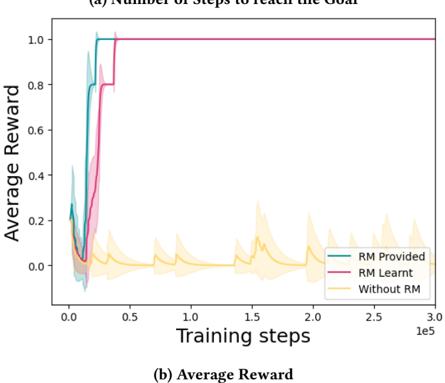
The image is a line chart comparing the average reward achieved during training steps for three different reinforcement learning (RL) scenarios: "RM Provided", "RM Learnt", and "Without RM". The x-axis represents training steps (in units of 1e5), and the y-axis represents the average reward, ranging from 0.0 to 1.0. The chart includes shaded regions around each line, indicating the variance or uncertainty in the reward values.
### Components/Axes
* **Title:** (a) Number of Steps to reach the Goal, (b) Average Reward
* **X-axis:** Training steps (labeled "Training steps"), scaled from 0.0 to 3.0 (representing 3.0 x 10^5 steps).
* **Y-axis:** Average Reward (labeled "Average Reward"), scaled from 0.0 to 1.0.
* **Legend:** Located in the bottom-right of the chart.
* **RM Provided:** Teal line
* **RM Learnt:** Pink line
* **Without RM:** Yellow line
### Detailed Analysis
* **RM Provided (Teal):**
* Trend: Initially increases rapidly, reaching a reward of approximately 0.8 around 0.2 x 10^5 training steps. It then plateaus at approximately 1.0 around 0.4 x 10^5 training steps.
* Data Points: Starts at approximately 0.2, rises to 0.8 around 0.2 x 10^5 steps, and reaches 1.0 around 0.4 x 10^5 steps.
* **RM Learnt (Pink):**
* Trend: Increases rapidly, reaching a reward of approximately 0.8 around 0.3 x 10^5 training steps, then plateaus at approximately 1.0 around 0.4 x 10^5 training steps.
* Data Points: Starts at approximately 0.1, rises to 0.8 around 0.3 x 10^5 steps, and reaches 1.0 around 0.4 x 10^5 steps.
* **Without RM (Yellow):**
* Trend: Starts low, fluctuates with several peaks and valleys, and remains generally low throughout the training steps.
* Data Points: Starts at approximately 0.1, fluctuates between 0.0 and 0.2, and remains below 0.2 throughout the training.
### Key Observations
* Both "RM Provided" and "RM Learnt" achieve significantly higher average rewards compared to "Without RM".
* "RM Provided" and "RM Learnt" converge to a reward of 1.0 much faster than "Without RM".
* "Without RM" exhibits more volatility and lower overall performance.
### Interpretation
The data suggests that using Reinforcement Management (RM), either provided or learned, significantly improves the average reward achieved during training. The "RM Provided" and "RM Learnt" scenarios demonstrate faster learning and higher final performance compared to the scenario "Without RM". The fluctuations in the "Without RM" scenario indicate instability and difficulty in learning without the aid of RM. The similarity in performance between "RM Provided" and "RM Learnt" suggests that the learned RM is as effective as the provided RM.