\n
## Line Chart: Average Reward vs. Training Steps
### Overview
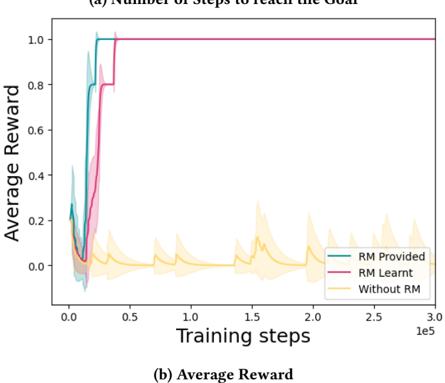
The image presents a line chart illustrating the relationship between training steps and average reward for three different scenarios: "RM Provided", "RM Learnt", and "Without RM". The chart appears to demonstrate the impact of Reward Modeling (RM) on the learning process, showing how providing or learning a reward model affects the average reward achieved during training. Shaded areas around each line represent the standard deviation or confidence interval.
### Components/Axes
* **X-axis:** "Training steps" - Scale ranges from 0 to 3.0e5 (300,000).
* **Y-axis:** "Average Reward" - Scale ranges from approximately -0.1 to 1.1.
* **Legend:** Located in the bottom-right corner.
* "RM Provided" - Represented by a teal/cyan line.
* "RM Learnt" - Represented by a magenta/purple line.
* "Without RM" - Represented by a yellow line.
* **Title:** "(a) Number of steps to reach the Goal" and "(b) Average Reward" - positioned above and below the chart respectively.
### Detailed Analysis
* **RM Provided (Teal Line):** The line starts at approximately 0.1 at training step 0, rapidly increases to around 0.8 by 10,000 training steps, and then plateaus around 0.95-1.0 from approximately 50,000 training steps onwards. The shaded area around the line is relatively small, indicating consistent performance.
* **RM Learnt (Magenta Line):** This line also starts at approximately 0.1 at training step 0, but its increase is slightly slower than "RM Provided". It reaches around 0.8 by 20,000 training steps and then quickly reaches a plateau around 1.0 from approximately 50,000 training steps onwards. The shaded area is also relatively small, similar to "RM Provided".
* **Without RM (Yellow Line):** This line exhibits significantly more fluctuation. It starts at approximately 0.05 at training step 0, initially increases to around 0.2 by 10,000 training steps, then fluctuates between approximately -0.1 and 0.3 for the remainder of the training period. The shaded area around this line is much larger than the other two, indicating high variability in performance.
### Key Observations
* Both "RM Provided" and "RM Learnt" achieve significantly higher average rewards compared to "Without RM".
* The learning process is faster when the reward model is provided ("RM Provided") compared to when it is learned ("RM Learnt").
* The "Without RM" scenario exhibits high variability and does not converge to a stable reward level.
* The shaded areas indicate that the "RM Provided" and "RM Learnt" scenarios have relatively low variance in their average rewards, suggesting more consistent performance.
### Interpretation
The data strongly suggests that incorporating a reward model, whether provided or learned, significantly improves the learning process and leads to higher average rewards. The faster convergence observed with "RM Provided" indicates that a well-defined reward model can accelerate learning. The high variability and low average reward in the "Without RM" scenario highlight the importance of a clear reward signal for effective reinforcement learning. The consistent performance (low variance) of the RM scenarios suggests that the reward model provides a stable and reliable guide for the learning agent. The chart demonstrates the effectiveness of reward modeling techniques in reinforcement learning, and the trade-off between providing a pre-defined reward model versus learning one during training. The difference in the initial slope of the lines suggests that the cost of learning the reward model is a slower initial learning rate.